3 Ways to Present Meaningful Information in Excel Using Budget Values
3 Ways to Present Meaningful Information in Excel Using Budget Values. When working with budget values in Excel, it’s important to display meaningful information that quickly communicates whether items are over or under budget. In this article, I will introduce three simple methods to achieve this.
3 Ways to Present Meaningful Information in Excel Using Budget Values
Using Expressions:
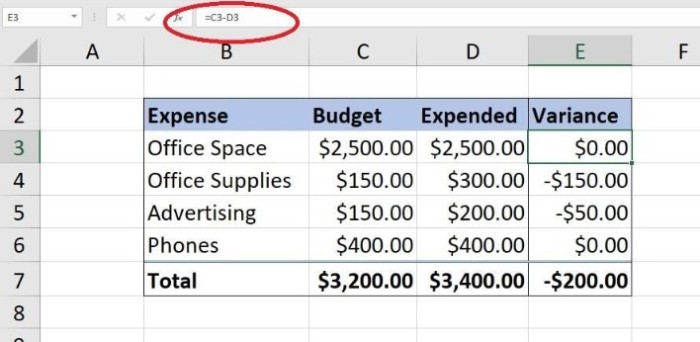
- Start by adding a basic expression that subtracts the actual expenses from the budgeted expenses. This expression provides an immediate indication of whether the item is over or under budget. Enter the formula “=C3-D3” in cell E3 and copy it to the rest of the data set. The resulting values will clearly show the budget variance.
Applying Conditional Formatting:
- Conditional formatting is a powerful tool for visualizing data. You can use it to highlight items that are over budget. Follow these steps:
- Select the data range (B3:D6 in this example).
- On the Home tab, click Conditional Formatting in the Styles group.
- Choose New Rule from the dropdown menu.
- In the dialog box, select “Use a formula to determine which cells to format.”
- Enter the formula “=$E3<0” in the Rule Description section.
- Click the Format button, choose a fill color, and click OK.
- Confirm the changes by clicking OK.
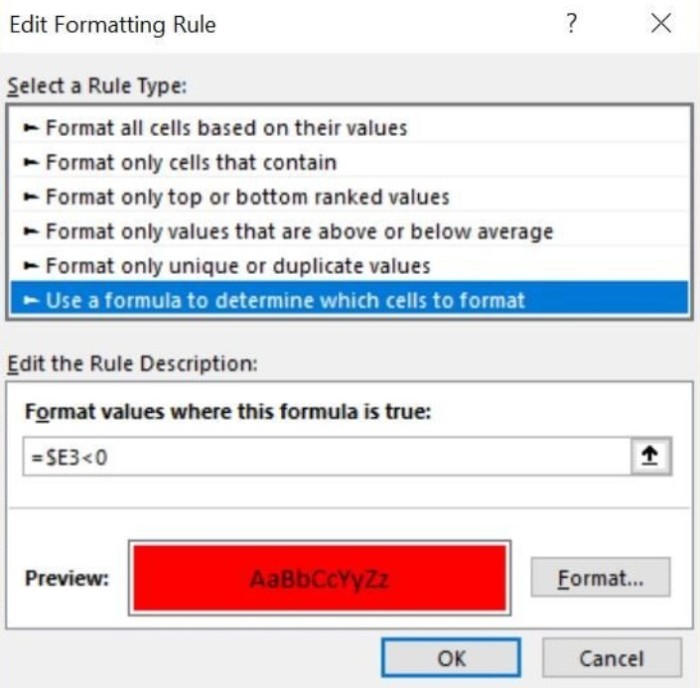
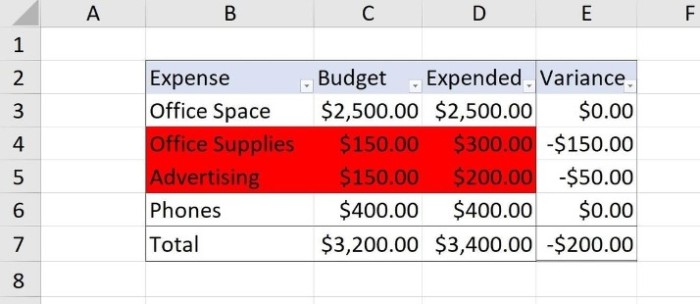
This rule will highlight items that are over budget, making them easily identifiable at a glance.
Utilizing In-Place Filtering:
- Since conditional formatting applies a fill color, you can use the filter option to display only the over-budget items. Follow these steps:
- Click anywhere inside the data range.
- On the Data tab, click Filter.
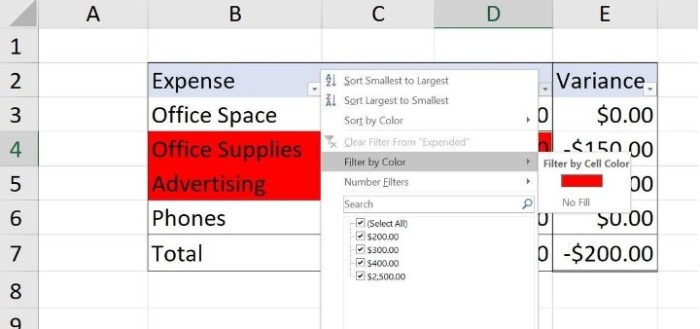
- Use the filter dropdown in any column and select “Filter By Color” > “Red” (or the color used for highlighting over-budget items).
- The filtered view will only display rows (budget items) that are over budget.

3 Ways to Present Meaningful Information in Excel Using Budget Values
This filtering method allows you to focus solely on the items that require attention.
Bonus: Counting Over-Budget Items:
To further analyze the data, you can count the number of items that are over budget. Add the following formulas:
- In cell H3: “=COUNTIF(E3:E6,”<0″)”
- In cell I3: “=COUNTIF(E3:E6,”>=0″)”

3 Ways to Present Meaningful Information in Excel Using Budget Values
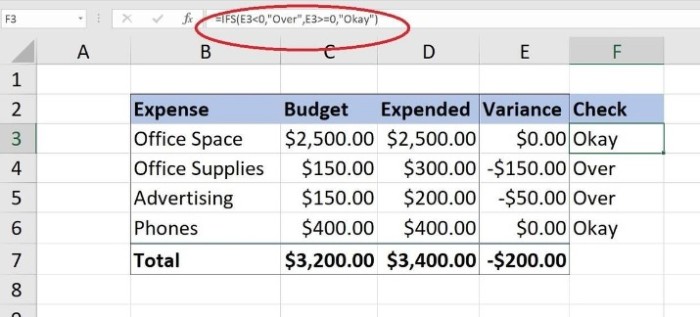
These formulas count the number of items with negative variances (over budget) and non-negative variances (on or under budget), respectively. You can modify the cell references based on your data range.
3 Ways to Present Meaningful Information in Excel Using Budget Values
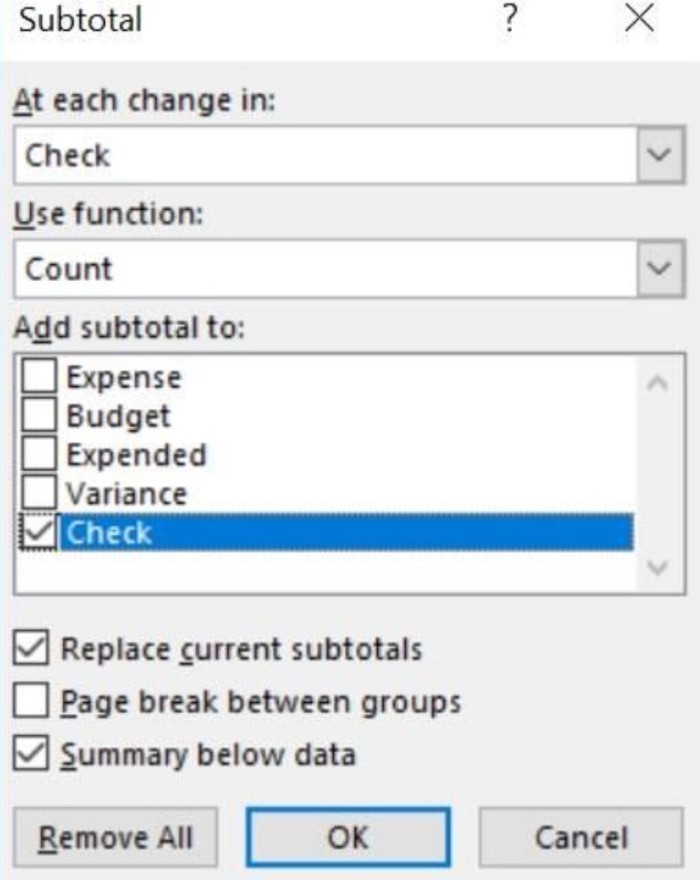
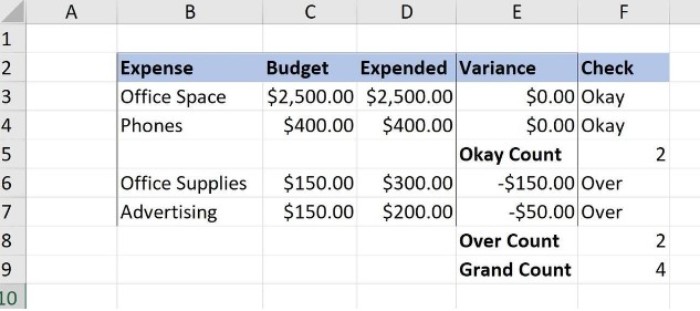
Alternatively, you can use the Subtotal feature to display the counts within the data set. First, sort the data by the Check column, and then go to the Data tab, click Subtotal in the Outline group, and configure the settings accordingly.
3 Ways to Present Meaningful Information in Excel Using Budget Values
In conclusion, these three methods provide simple yet effective ways to present meaningful information using budget values in Excel. By applying expressions, conditional formatting, and filtering techniques, you can quickly identify and analyze items that deviate from the budgeted amounts.
3 Ways to Present Meaningful Information in Excel Using Budget Values


