STOCKHISTORY Function In Excel: Checking Stock Data

If you are interested in the stock market, with a simple formula, you can track stock data over time for a company right in the familiar Excel tool. At the end of 2019, Microsoft introduced the STOCKHISTORY function to make this process easier. Let’s explore the syntax and how to use this function with Buffcom.net!
What is the STOCKHISTORY Function in Excel?
The STOCKHISTORY function – one of the new dynamic array formulas – will help you obtain historical stock prices and exchange rates for a company over a daily, weekly, or monthly period. This function utilizes the Stocks data type linked to an online source of information, and dynamic array functionality to retrieve stock prices on different dates.
The STOCKHISTORY function not only updates stock information but can also be used to view bond data, index fund data, mutual fund data, bond pairs, currency pairs, and more.
This function is relatively new and is currently only available in Office 365.
Syntax of the STOCKHISTORY Function in Excel
Stock History Function Formula
=STOCKHISTORY(stock, start_date, [end_date], [interval], [headers], [property0], [property1] [property2], [property3], [property4], [property5])
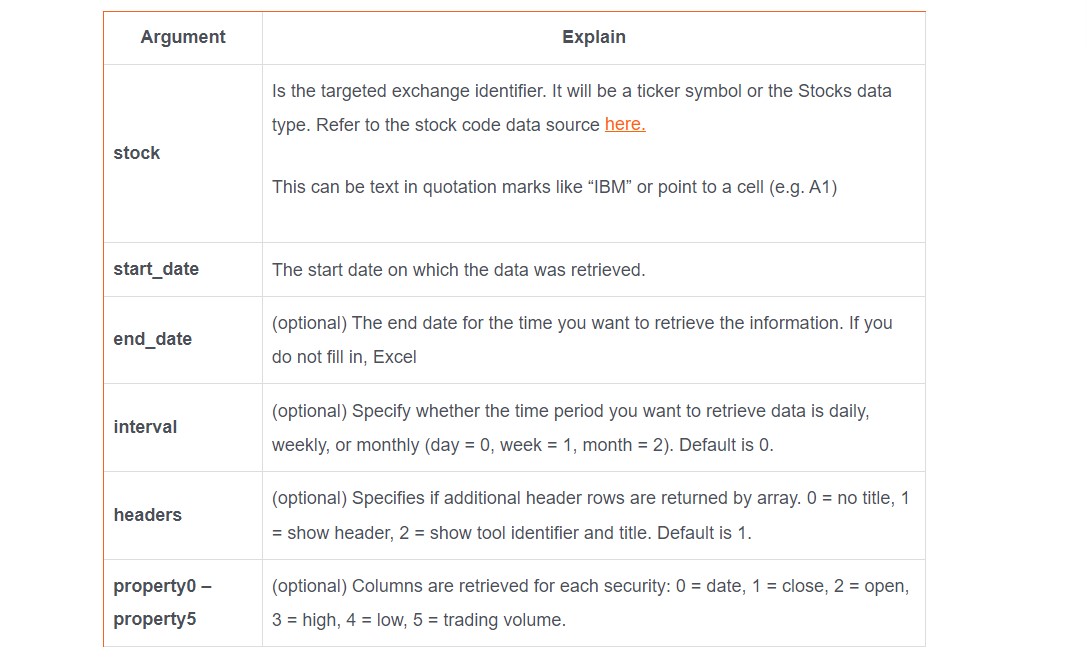
Explanation of Parameters in the Formula

Note:
- The date parameters (start_date and end_date) can be a date placed in double quotes (e.g., “01-01-2020”), a formula (e.g., TODAY()), or a reference to a cell containing a date (e.g., A3)
- The return date may be earlier than the date provided. For example: if the start_date is March 29, 2022 with a monthly data retrieval interval (interval=2), the returned data will start from March 1, 2022 for the requested period.The safest way to provide start_date and end_date is to reference a
- cell containing a valid date or use the DATE function. This is because date inputs in text value format can sometimes be misinterpreted.
Example of the STOCKHISTORY function in Excel
Example 1: You want to check the stock data of Apple (with the stock code AAPL) for today. In Office 365 Excel, you enter the following formula:
=STOCKHISTORY(“AAPL”, TODAY())
However, note that not every day is a trading day for that exchange, so if it is not a trading day, Excel will display the #VALUE! error due to non-trading day.
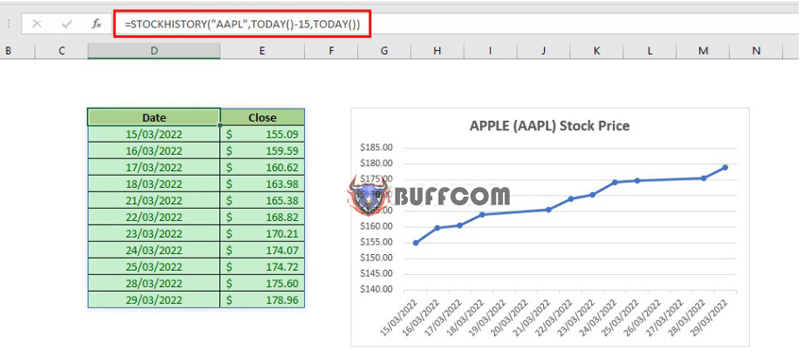
Example 2: To check the stock data of Apple within a 15-day period from today, you use the formula:
=STOCKHISTORY(“AAPL”, TODAY()-15, TODAY())
 Excel returns a table with many results as shown in the figure above. You can insert a chart to visualize the data and easily observe the fluctuations in stock prices.
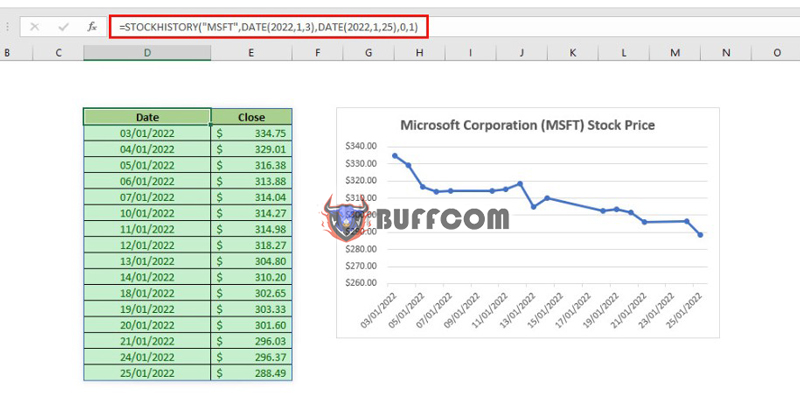
Example 3: To check Microsoft’s stock data (with stock code MSFT) weekly, within the period from January 3, 2022, to January 25, 2022, you enter the formula:
=STOCKHISTORY(“MSFT”, DATE(2022, 1, 3), DATE(2022, 1, 25), 1, 1)
 Conclusion
Through this article, Buffcom.net hopes that you have gained a better understanding of a new and interesting function – STOCKHISTORY. Excel has many great features that you may not have fully utilized, so make sure to regularly visit the Buffcom.net website to update yourself with useful Excel knowledge!
In addition, if you are interested in purchasing a licensed office software, please contact Buffcom.net for support!


