Pivot Table – A Useful Tool for Data Analysis and Reporting in Excel

A Pivot Table is a tool used for analyzing data in a spreadsheet, and it is integrated into Excel. However, few people know about this tool and how to use it. In this article, Buffcom.net will share how to analyze data with Pivot Table in a simple way!
Understanding Pivot Table – An Excellent Data Reporting Tool in Excel
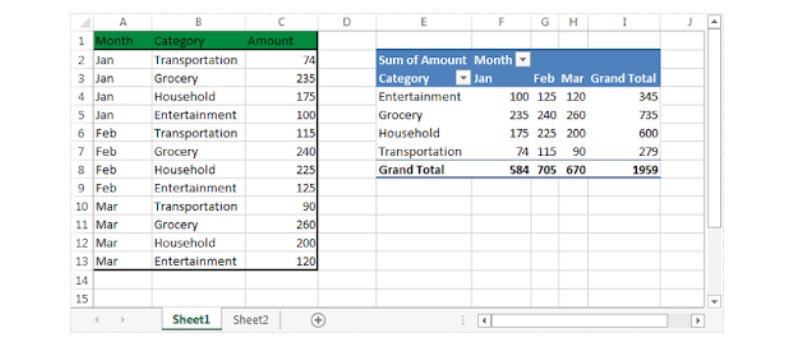
Pivot Table is a great feature of Excel. It helps you quickly calculate, summarize, and analyze large amounts of data.
 This feature is extremely useful for those who frequently work with data. It meets requirements such as extracting data, creating reports, and statistics…
So, the following section will guide you on how to use Pivot Table in Excel in the most detail!
Creating Data Analysis Reports on Pivot Table in Excel
Insert Pivot Table
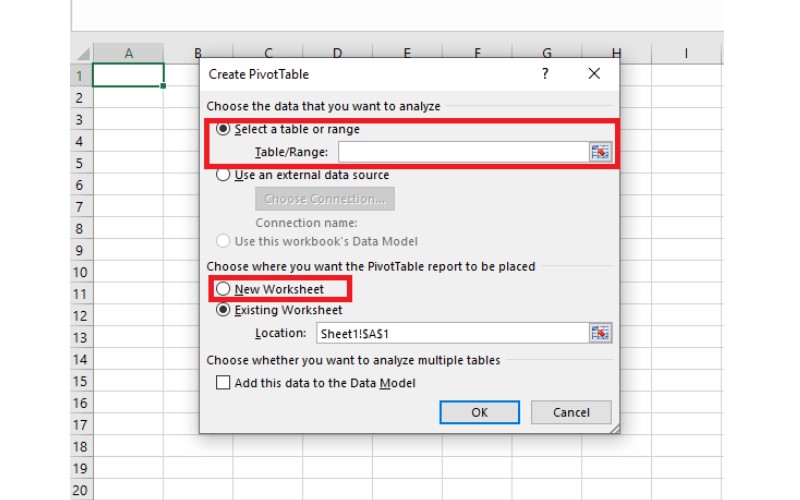
Select the data range on the entered worksheet that you want to create a Pivot Table. Select Insert, Pivot Table button.
 You should leave the default option as New Worksheet to create a Pivot Table on a new worksheet.
 Press OK.
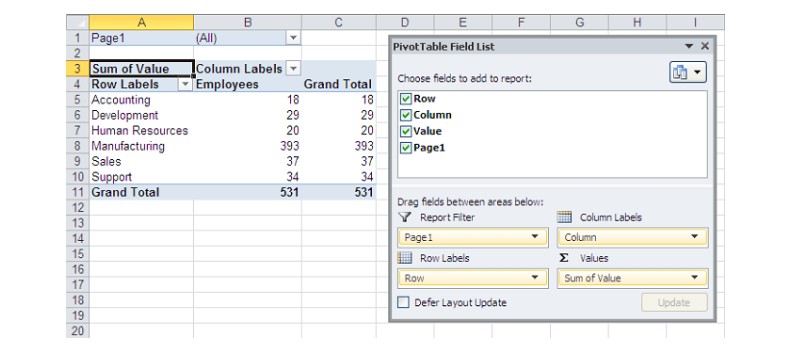
The Pivot Table workspace appears along with a table of options for displaying fields in the table. Depending on the purpose, you will choose the fields to display in the report as well as filter features, summary functions… for the data.
 Press OK to have the report table created using Pivot Table.
Using Pivot Table in Excel is very simple, it will help you save a lot of time in statistical analysis, data analysis, and creating information reports. This tool helps your work go smoother, more efficiently, and faster.
In addition to Pivot Table, you can also use Data Analysis to statistically analyze and work with data in Excel.
In this article, you are provided with knowledge of data building tools, working with data, data insights, and analyzing practical business problems. It is useful for business owners, department heads, and human resources – sales staff. If you need licensed office software, contact Buffcom.net!


