Basic Guide to Using PivotTable for Beginners
PivotTable is a tool used to analyze data from various perspectives and different requirements from a list or a table. PivotTable can help you summarize, filter, and analyze data by groups and condense data as per your requirements. The results of PivotTable can be further used to calculate new metrics to serve various purposes. This article will guide you on how to use PivotTable to create a statistical revenue report by product groups, regions, and months.
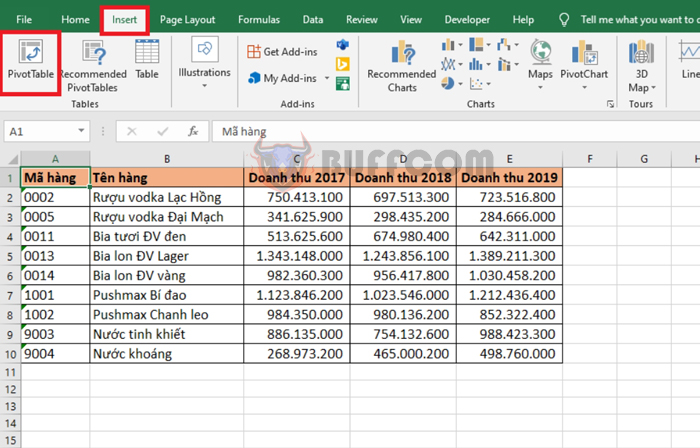
 Step 1: Creating a PivotTable
First, place the mouse pointer on any cell within the data range where you want to create a PivotTable. Then, go to the “Insert” tab => “PivotTable.”
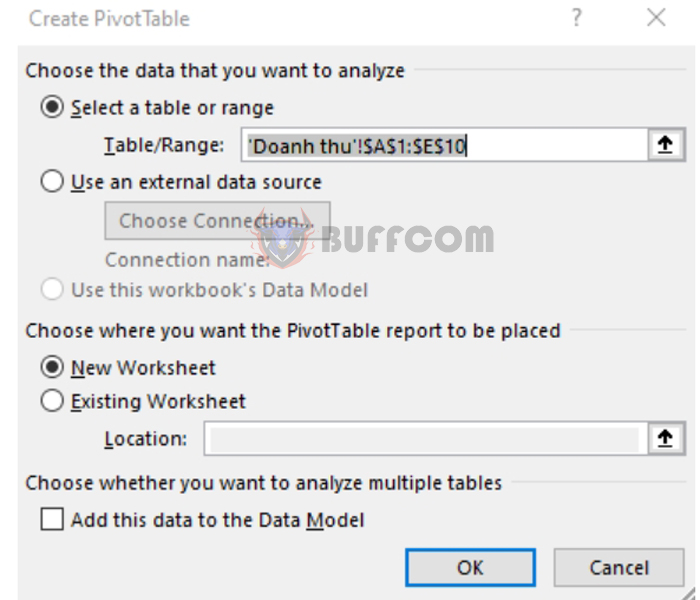
 A “Create PivotTable” dialog box will appear. The “Table/Range” field will display the address of the data range. Choose where you want to place the PivotTable report in the “Choose where you want the PivotTable report to be placed” section.
- New Worksheet: Set in a new sheet.
- Existing Worksheet: Set in the current sheet. If you choose this option, you need to select the location for the PivotTable in the “Location” field.
Finally, press OK to create the PivotTable.
 Step 2: Creating Analysis Fields
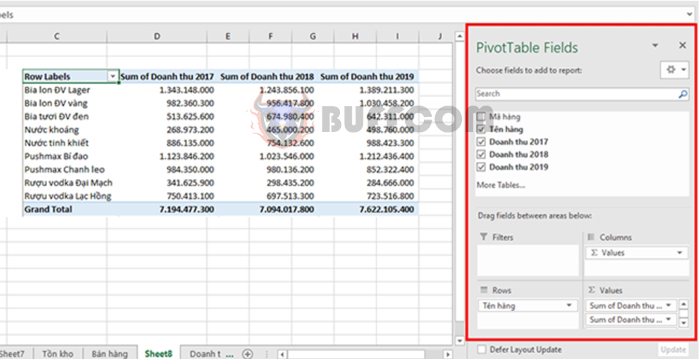
After pressing OK, Excel will display the “PivotTable Fields” window on the right side of the screen. In this section, there are two parts:
Choose fields to add to the report: Select the data fields to add to the PivotTable report.
Drag fields between areas below: 4 areas to drop the selected data fields from the “Choose fields to add to the report” section.
- Filter: Data filtering area.
- Columns: Column names.
- Rows: Row names.
- Values: Values you want to display.
 Step 3: Filtering Data for Individual Analysis
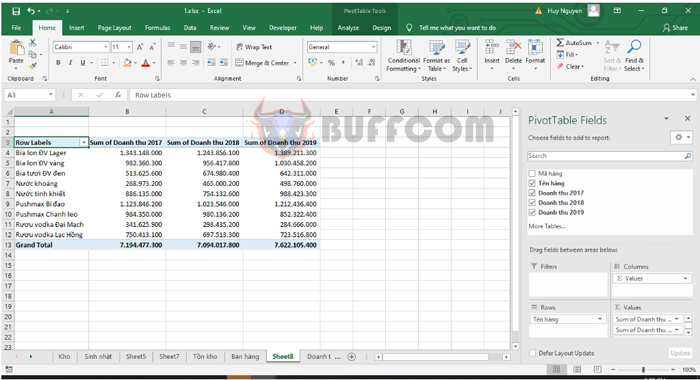
After creating the analysis fields, the “Filter” will be available in the first column of the table. To filter the data, left-click on the Filter icon, and the list of data in the column will appear for you to choose from.
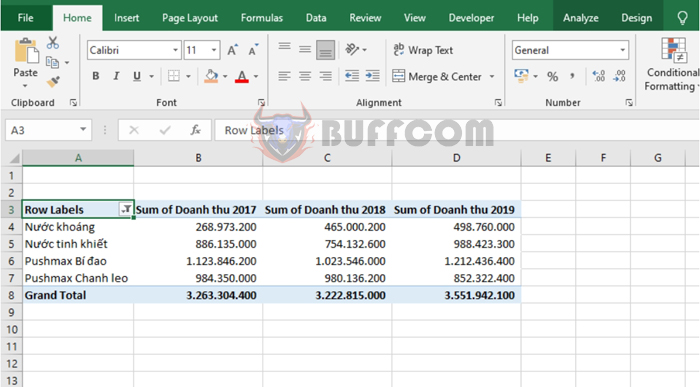
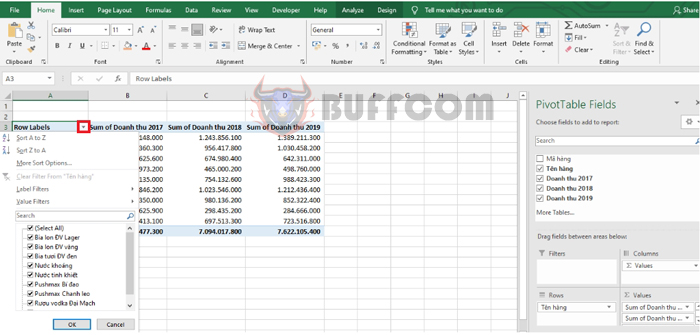 Simply select the items you want to analyze individually, then press OK, and those items will be filtered separately.
Basic Guide to Using PivotTable for Beginners
In this way, the article has guided you on how to use PivotTable in Excel. Hopefully, it will be helpful to you in your work. Good luck!


