• ChatGPT Business
  • Microsoft Office
  • Microsoft Windows
  • Other Software
    • Microsoft Visual
    • Microsoft Project
    • Microsoft Visio
    • Anti Virus
  • Blog
    • Word
    • Excel
    • Powerpoint
    • Software tricks/tips

No products in the cart.

  • ChatGPT Business
  • Microsoft Office
  • Microsoft Windows
  • Other Software
    • Microsoft Visual
    • Microsoft Project
    • Microsoft Visio
    • Anti Virus
  • Blog
    • Word
    • Excel
    • Powerpoint
    • Software tricks/tips

No products in the cart.

  • ChatGPT Business
  • Microsoft Office
  • Microsoft Windows
  • Other Software
    • Microsoft Visual
    • Microsoft Project
    • Microsoft Visio
    • Anti Virus
  • Blog
    • Word
    • Excel
    • Powerpoint
    • Software tricks/tips

No products in the cart.

  • ChatGPT Business
  • Microsoft Office
  • Microsoft Windows
  • Other Software
    • Microsoft Visual
    • Microsoft Project
    • Microsoft Visio
    • Anti Virus
  • Blog
    • Word
    • Excel
    • Powerpoint
    • Software tricks/tips
Excel

How to create 2 Excel charts on the same graph?

0 Comments

How to create 2 Excel charts on the same graph?: Assuming that you want to create a combined column chart and a line chart, what steps do you need to take? You can draw two separate graphs, but this is not always the best solution. The best solution is to combine them on the same graph, meaning that you will draw two charts on the same Excel graph. This article will guide you through the steps of creating two Excel charts on the same graph.

Step 1: Select Insert > Column > 2-D Column

First, at the Excel interface, the user needs to have a data table to create a chart. We already have a data table as shown below to represent it in the form of a chart:

How to create 2 Excel charts on the same graph

How to create 2 Excel charts on the same graph

First, you highlight the data table, then select the Insert tab on the toolbar. Next, you click on the Column option to draw a column chart. Since the table above has two criteria, we continue to select the 2-D Column option. You will understand better by observing the following image:

How to create 2 Excel charts on the same graph

How to create 2 Excel charts on the same graph

After that, you will get a chart corresponding to two columns as shown below. The dark blue column represents the sold items, and the light blue column corresponds to the inventory.

How to create 2 Excel charts on the same graph

How to create 2 Excel charts on the same graph

Step 2: Select Change Chart Type… to change the chart type

At the chart, right-click and select Change Chart Type… to change the chart type.

How to create 2 Excel charts on the same graph

How to create 2 Excel charts on the same graph

1. Column chart

At this point, the Change Chart Type window appears on the screen to provide options for you. To change the type of the column chart, select Column. You choose the appropriate column of data and then click OK to complete.

How to create 2 Excel charts on the same graph

How to create 2 Excel charts on the same graph

After that, you will get a complete column chart as shown below. At this time, the two previous chart columns have been combined and represented by different colors.

How to create 2 Excel charts on the same graph

How to create 2 Excel charts on the same graph

You can also choose different chart types depending on your usage needs.

2. Combined line and column chart

In case you want to draw a combined line and column chart, left-click on the criterion you want to convert to a line type. Then click on Change Series Chart Type.

How to create 2 Excel charts on the same graph

How to create 2 Excel charts on the same graph

In the Change Chart Type window, click on Line to represent the line chart. Then you choose the appropriate type of line chart and click OK to complete.

How to create 2 Excel charts on the same graph

How to create 2 Excel charts on the same graph

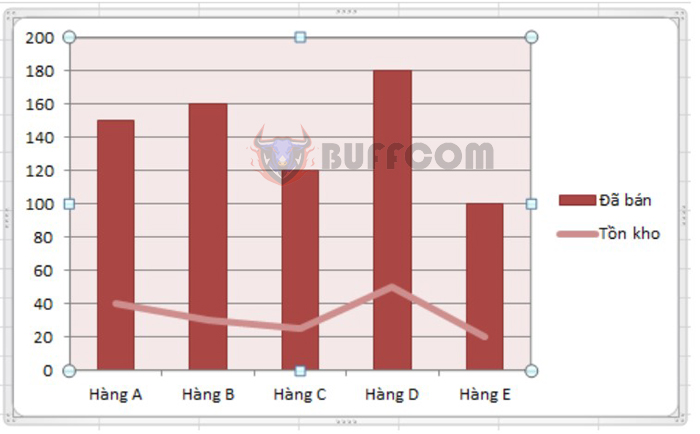
At that time, the new chart will be displayed on the screen. The inventory criterion has been converted to a line type.

How to create 2 Excel charts on the same graph

How to create 2 Excel charts on the same graph

The new chart will then be displayed on the screen. The inventory level metric has been converted to a line chart as desired.

If you want to adjust the chart, click on the Design tab. Finally, you have created a complete graph like the one shown below.

How to create 2 Excel charts on the same graph

How to create 2 Excel charts on the same graph

Different chart types can help users better visualize and understand numerical data. Therefore, mastering various chart types is essential in Excel.

This article has provided instructions on how to create two Excel charts on the same graph. Hopefully, this article has provided useful information for readers. Good luck with your implementation!

Rate this post
41
259 Views
How to disable Update Link notification while preserving Excel file dataPrevHow to disable Update Link notification while preserving Excel file dataMarch 7, 2023
How to Quickly Disable Privacy Warning in ExcelMarch 8, 2023How to Quickly Disable Privacy Warning in ExcelNext

Leave a Reply Cancel reply

You must be logged in to post a comment.

Buy Windows 11 Professional MS Products CD Key
Buy Office 2021 Professional Plus Key Global For 5 PC
Top rated products
  • Windows Server 2022 Datacenter Key Global Windows Server 2022 Datacenter Key Global
    Rated 5.00 out of 5
    $7.00
  • Kaspersky Small Office Security 10 PCs + 10 Mobiles + 1 Server 1 Year Kaspersky Small Office Security 10 PCs + 10 Mobiles + 1 Server 1 Year
    Rated 5.00 out of 5
    $164.50
  • Avast Ultimate Suite 2021 1 Year 10 Devices Global Avast Ultimate Suite 2021 1 Year 10 Devices Global
    Rated 5.00 out of 5
    $54.00
  • Windows 11 Pro Key Global Windows 11 Pro Key Global
    Rated 5.00 out of 5
    $6.00
  • Avast Premium Security 2021 10 Devices 2 Years Global Avast Premium Security 2021 10 Devices 2 Years Global
    Rated 5.00 out of 5
    $41.00
Products
  • Avast Ultimate Suite 2021 3 Years 10 Devices Global Avast Ultimate Suite 2021 3 Years 10 Devices Global
    Rated 5.00 out of 5
    $90.00
  • AVG Internet Security 2021 1 Device 1 Year Global AVG Internet Security 2021 1 Device 1 Year Global
    Rated 5.00 out of 5
    $11.00
  • Project Standard 2021 Microsoft Project Standard 2021 - 1 PC $13.00
  • Microsoft Project 2019 professional Key Global Bind to your Microsoft Account Microsoft Project 2019 professional Key Global Bind to your Microsoft Account
    Rated 4.93 out of 5
    $12.00
  • Microsoft Visio 2016 professional CD Key Global Microsoft Visio 2016 professional CD Key Global
    Rated 4.94 out of 5
    $28.50
  • Microsoft Visio 2019 Professional Key Global Microsoft Visio 2019 Professional Key Global - 5 PC
    Rated 4.93 out of 5
    $19.00
  • Avast Ultimate Suite 2021 1 Year 10 Devices Global Avast Ultimate Suite 2021 1 Year 10 Devices Global
    Rated 5.00 out of 5
    $54.00
  • Avast SecureLine VPN 2021 2 Years 5 Devices Global Avast SecureLine VPN 2021 2 Years 5 Devices Global
    Rated 5.00 out of 5
    $47.00
  • Office 2024 Home And Business For Mac/Pc Bind Office 2024 Home And Business For Mac/Pc Bind $99.00
  • Windows Server 2008 R2 Standard Windows Server 2008 R2 Standard $10.00
Product categories
  • Anti Virus
  • Microsoft Office
  • Microsoft Project
  • Microsoft Visio
  • Microsoft Visual
  • Microsoft Windows
  • Other Software
  • Uncategorized

Buffcom.net always brings the best digital products and services to you. Specializing in Office Software and online marketing services

BIG SALE 50% IN MAY

Microsoft Office
Microsoft Windows
Anti-Virus
Contact Us

Visit Us:

125 Division St, New York, NY 10002, USA

Mail Us:

buffcom.net@gmail.com

TERMS & CONDITIONS | PAYMENT GUIDE  | SHIPPING POLICY  | REFUND POLICY

Copyright © 2019 buffcom.net  All Rights Reserved.