• ChatGPT Business
  • Microsoft Office
  • Microsoft Windows
  • Other Software
    • Microsoft Visual
    • Microsoft Project
    • Microsoft Visio
    • Anti Virus
  • Blog
    • Word
    • Excel
    • Powerpoint
    • Software tricks/tips

No products in the cart.

  • ChatGPT Business
  • Microsoft Office
  • Microsoft Windows
  • Other Software
    • Microsoft Visual
    • Microsoft Project
    • Microsoft Visio
    • Anti Virus
  • Blog
    • Word
    • Excel
    • Powerpoint
    • Software tricks/tips

No products in the cart.

  • ChatGPT Business
  • Microsoft Office
  • Microsoft Windows
  • Other Software
    • Microsoft Visual
    • Microsoft Project
    • Microsoft Visio
    • Anti Virus
  • Blog
    • Word
    • Excel
    • Powerpoint
    • Software tricks/tips

No products in the cart.

  • ChatGPT Business
  • Microsoft Office
  • Microsoft Windows
  • Other Software
    • Microsoft Visual
    • Microsoft Project
    • Microsoft Visio
    • Anti Virus
  • Blog
    • Word
    • Excel
    • Powerpoint
    • Software tricks/tips
Excel

How to draw a function graph on Excel extremely simply and quickly

0 Comments

How to draw a function graph on Excel: Back when you were in school, you probably got used to different types of function graphs such as linear, quadratic, cubic, etc., and then how to draw each function using various types of graphs. You would realize that drawing these graphs could be complicated with many steps. Luckily, Excel now supports drawing function graphs with only very fast, accurate and easy-to-see steps. For more details on how to draw function graphs, please refer to the following article.

Step 1: Select the type of function graph

First, enter 2 number sequences for the equation. Then, highlight the first number sequence and select Insert, then click on the Scatter icon on the toolbar. Then choose the graph you want.

How to draw a function graph on Excel extremely simply and quickly

How to draw a function graph on Excel extremely simply and quickly


Step 2: Enter the smallest and largest values for the graph

Next, double-click the number sequence on the left side of the graph. This will help you change the values in the graph.

How to draw a function graph on Excel extremely simply and quickly

How to draw a function graph on Excel extremely simply and quickly


We adjust the values of the graph. The min and max value input will depend on the smallest and largest values of sequence 1 and sequence 2. In the Axis Options section, you can adjust the smallest value to be -5.0 and the largest value to be 5.0. And then, the value of the number sequence will change as shown below:

How to draw a function graph on Excel extremely simply and quickly

How to draw a function graph on Excel extremely simply and quickly

Step 3: Add other values to the graph

At the function graph, right-click and select Select Data.

How to draw a function graph on Excel extremely simply and quickly

How to draw a function graph on Excel extremely simply and quickly


In the Select Data Source interface, click on Add to add values to the graph. This will allow you to add different values to the graph quickly.

How to draw a function graph on Excel extremely simply and quickly

How to draw a function graph on Excel extremely simply and quickly

In the new interface, at Series Y values, use the mouse to highlight the second number sequence in the table above. This operation helps you enter values for sequence Y. Then click OK to add the values.

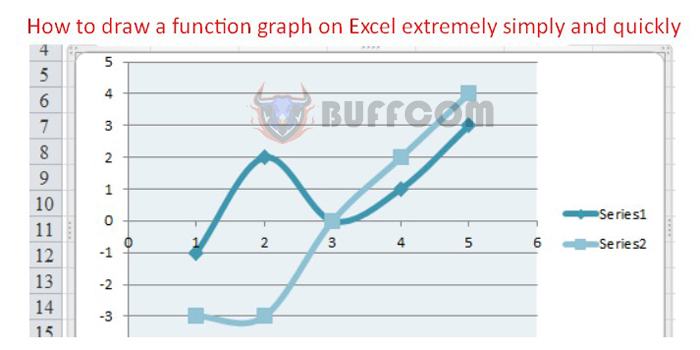
Then, we get a function graph like the following picture:

How to draw a function graph on Excel extremely simply and quickly

How to draw a function graph on Excel extremely simply and quickly

Step 4: Change the display style and color for the graph

In case you want to change the display style and color of the graph, select Design on the toolbar. Here, you can choose the graph styles you want to use.

How to draw a function graph on Excel extremely simply and quickly

How to draw a function graph on Excel extremely simply and quickly

After the steps are completed, the graph will change as illustrated below:

In conclusion, drawing a function graph on Excel is a quick and easy task that can be done in just a few steps. By following the steps outlined in this article, you can create accurate and visually appealing function graphs for your presentations or reports. With the ability to adjust values, add data, and change display styles, Excel offers a flexible and efficient way to create function graphs that meet your specific needs. Give it a try and see for yourself how easy it can be to create professional-looking function graphs on Excel.

Rate this post
46
287 Views
How to quickly remove password from Excel filePrevHow to quickly remove password from Excel fileMarch 24, 2023
How to Automatically Color Duplicate Data Cells in ExcelMarch 24, 2023How to Automatically Color Duplicate Data Cells in ExcelNext

Leave a Reply Cancel reply

You must be logged in to post a comment.

Buy Windows 11 Professional MS Products CD Key
Buy Office 2021 Professional Plus Key Global For 5 PC
Top rated products
  • Kaspersky Total Security 2021 1 year 5 devices key Global Kaspersky Total Security 2021 1 year 5 devices key Global
    Rated 5.00 out of 5
    $46.00
  • Avast Premium Security 2021 Avast Premium Security 2021 1 Device 1 Year Global
    Rated 5.00 out of 5
    $11.00
  • Trend Micro Internet Security 3 Devices 1 Year Key GLOBAL Trend Micro Internet Security 3 Devices 1 Year Key GLOBAL
    Rated 5.00 out of 5
    $17.00
  • Windows 11 Pro Key Global Windows 11 Pro Key Global
    Rated 5.00 out of 5
    $6.00
  • AVG Internet Security 2021 10 Devices 2 Years Global AVG Internet Security 2021 10 Devices 2 Years Global
    Rated 5.00 out of 5
    $42.20
Products
  • Windows Server 2016 Datacenter Key Global Windows Server 2016 Datacenter Key Global
    Rated 4.74 out of 5
    $10.00
  • Microsoft Visio Standard 2021 Key 1PC Microsoft Visio Standard 2021 Key 1PC $13.00
  • Buy Windows 11 Pro CD Key License Buy Windows 11 Pro CD Key License
    Rated 5.00 out of 5
    $6.00
  • Windows 10 Pro OEM Key Global - Reinstalling win is still active Windows 10 Pro OEM Key Global - Reinstalling win is still active
    Rated 4.88 out of 5
    $6.00
  • Kaspersky Small Office Security 20 PCs + 20 Mobiles + 2 Servers 1 Year Kaspersky Small Office Security 20 PCs + 20 Mobiles + 2 Servers 1 Year $284.73
  • Windows Server2008 R2 Remote Desktop Services user connections (20)cal Windows Server2008 R2 Remote Desktop Services user connections (20)cal $29.00
  • Microsoft Visio Professional 2016 Key 1PC Microsoft Visio Professional 2016 Key 1PC $9.00
  • Windows 10 Enterprise LTSC 2019 Key Global Windows 10 Enterprise LTSC 2019 Key Global
    Rated 4.83 out of 5
    $9.00
  • Microsoft Visual Studio 2022 Professional Key Microsoft Visual Studio 2022 Professional Key $19.00
  • Avast SecureLine VPN 2021 2 Years 5 Devices Global Avast SecureLine VPN 2021 2 Years 5 Devices Global
    Rated 5.00 out of 5
    $47.00
Product categories
  • Anti Virus
  • Microsoft Office
  • Microsoft Project
  • Microsoft Visio
  • Microsoft Visual
  • Microsoft Windows
  • Other Software
  • Uncategorized

Buffcom.net always brings the best digital products and services to you. Specializing in Office Software and online marketing services

BIG SALE 50% IN MAY

Microsoft Office
Microsoft Windows
Anti-Virus
Contact Us

Visit Us:

125 Division St, New York, NY 10002, USA

Mail Us:

buffcom.net@gmail.com

TERMS & CONDITIONS | PAYMENT GUIDE  | SHIPPING POLICY  | REFUND POLICY

Copyright © 2019 buffcom.net  All Rights Reserved.