How to Create an Organizational Chart in Excel

In a company/organization, there are many members with different positions. To show the relationships and hierarchy of members, you can use an organizational chart. The chart will help viewers understand the composition, position, and tasks of each member in the company. This article will guide you on how to create an organizational chart in Excel with just a few basic steps.
Creating the Organizational Chart
To create an organizational chart in Excel, follow these steps:
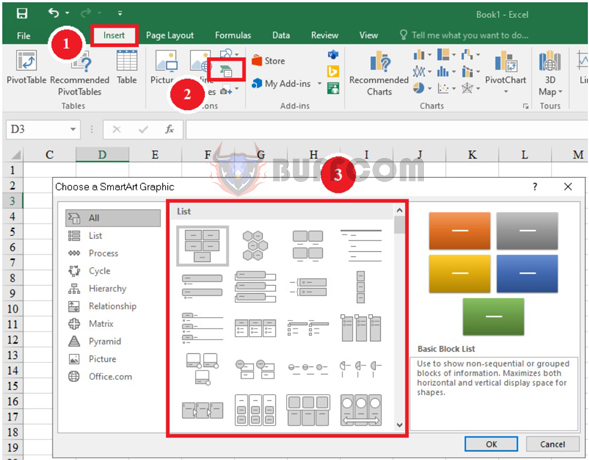
Step 1: Select Insert on the toolbar.
Step 2: Select the SmartArt icon.
Step 3: Choose the appropriate chart in the Choose a SmartArt Graphic dialog box.
 Step 4: Enter the data into the chart.
After selecting the chart in Step 3, the chart will be displayed with a Type your text here window to enter the data.
You can enter the data into this window or directly into the chart.
 Editing the Chart
Adding and Remo ving Boxes in the Chart
Suppose your department has a manager and 2 assistant managers, but the current chart only has 1 box to represent the assistant manager. To add a box at the same level as the assistant manager box, simply select the existing assistant manager box, and then press Enter. Immediately, a similar box will appear as shown below. For other positions, you can do the same to add boxes at the same level.
 To add a box at a lower level than the original box, for example, if you need to add a supervisor box under the assistant manager box, do the following:
- Select the assistant manager box.
- Press Enter.
- Press the Tab key.
Now, the sub-box will appear under the assistant manager box.
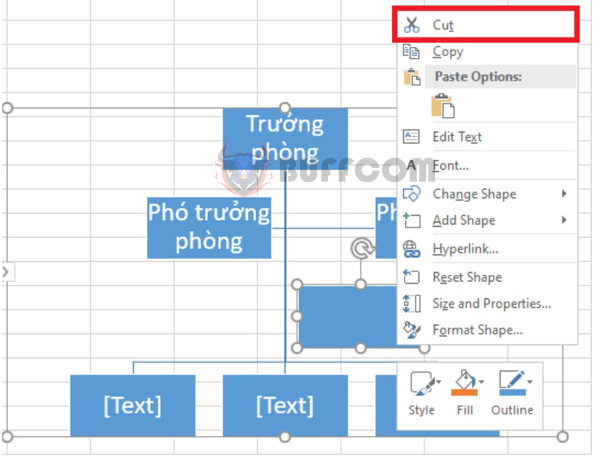
 To delete a box in the chart, right-click on the box you want to delete and select Cut.
 Choosing Colors for the Chart
To make the chart more lively, you can choose colors as follows:
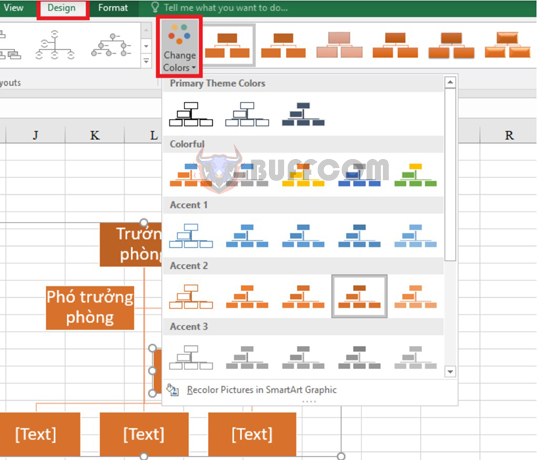
- Select the Design tab.
- Select Change Colors. Then choose the color you want.
 After choosing the color, you can see that boxes at the same level will have the same color.
 The above is a guide to creating an organizational chart in Excel with just 4 simple steps. We hope this helps and wish you success.


