How to quickly view statistics in Microsoft Excel

How to quickly view statistics in Microsoft Excel: Excel provides users with tools to quickly view statistics during work, such as totals, averages, etc. Follow the article below to learn more about this tool.
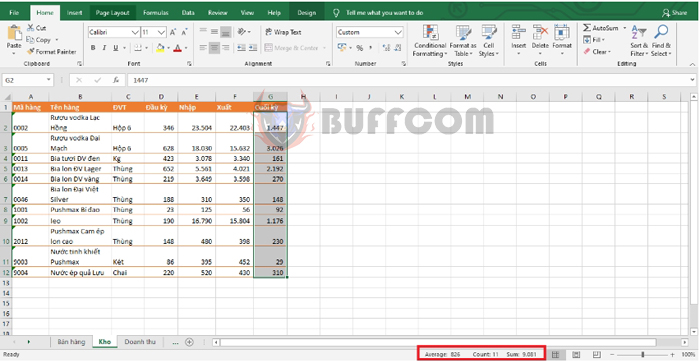
To view statistics quickly, first open the Excel file. Then, select the cells that you want to view the data statistics for. At this point, the basic statistical parameters of the selected data range will appear in the lower right corner of the screen.

How to quickly view statistics in Microsoft Excel
Typically, Excel defaults to three basic parameters:
- Average: Mean
- Count: Number of cells with data
- Sum: Total
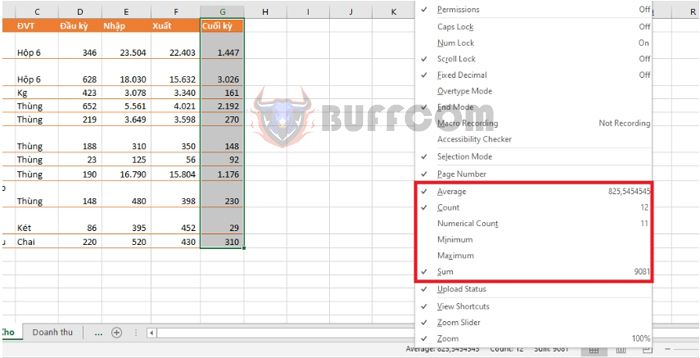
If you want to add more parameters, simply right-click on the list. A scroll bar will appear with additional options to choose from, such as:
- Average: Mean
- Count: Number of cells with data
- Numerical Count: Number of cells with numbers
- Minimum: Smallest number
- Maximum: Largest number
- Sum: Total

How to quickly view statistics in Microsoft Excel
These parameters are quite easy to understand, except that Count and Numerical Count may be confused.
- Count will count all cells with data, including numbers and text, and ignore blank cells.
- Numerical Count only counts cells with numbers and ignores cells with text and blank cells.
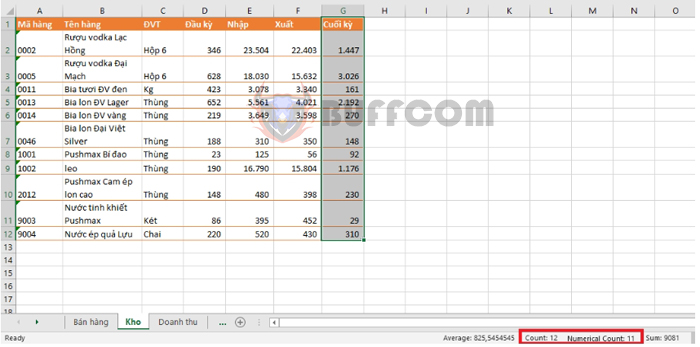
For example, in this case, Count will count the header cell, so the result is 12. Numerical Count, on the other hand, will ignore the header cell, so the result is 11.
 Hopefully, this article will be useful to you in your work. Good luck!


