• ChatGPT Business
  • Microsoft Office
  • Microsoft Windows
  • Other Software
    • Microsoft Visual
    • Microsoft Project
    • Microsoft Visio
    • Anti Virus
  • Blog
    • Word
    • Excel
    • Powerpoint
    • Software tricks/tips

No products in the cart.

  • ChatGPT Business
  • Microsoft Office
  • Microsoft Windows
  • Other Software
    • Microsoft Visual
    • Microsoft Project
    • Microsoft Visio
    • Anti Virus
  • Blog
    • Word
    • Excel
    • Powerpoint
    • Software tricks/tips

No products in the cart.

  • ChatGPT Business
  • Microsoft Office
  • Microsoft Windows
  • Other Software
    • Microsoft Visual
    • Microsoft Project
    • Microsoft Visio
    • Anti Virus
  • Blog
    • Word
    • Excel
    • Powerpoint
    • Software tricks/tips

No products in the cart.

  • ChatGPT Business
  • Microsoft Office
  • Microsoft Windows
  • Other Software
    • Microsoft Visual
    • Microsoft Project
    • Microsoft Visio
    • Anti Virus
  • Blog
    • Word
    • Excel
    • Powerpoint
    • Software tricks/tips
Excel

How to create Sparklines to analyze data in Excel

0 Comments

How to create Sparklines to analyze data in Excel: Sparkline is a small chart placed in a single cell that provides you with a representative image of the selected dataset. Sparklines allow you to quickly view and analyze relationships and trends for multiple data series at once, such as to demonstrate the growth of products, businesses, or individuals. In this article, Buffcom.net will provide a detailed guide on how to use Sparklines in Excel.

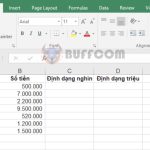
For example, suppose we have a revenue table from 2016 to 2019 for various soft drink items as shown in the figure below. In this case, we only need to create Sparklines for each item to quickly analyze the revenue fluctuations of each item over the years, without the need to create a Chart. To create Sparklines, follow these steps.

How to create Sparklines to analyze data inStep 1: Select the Insert tab on the Ribbon => then select the Line icon under Sparklines.

How to create Sparklines to analyze data in Excel

How to create Sparklines to analyze data in Excel

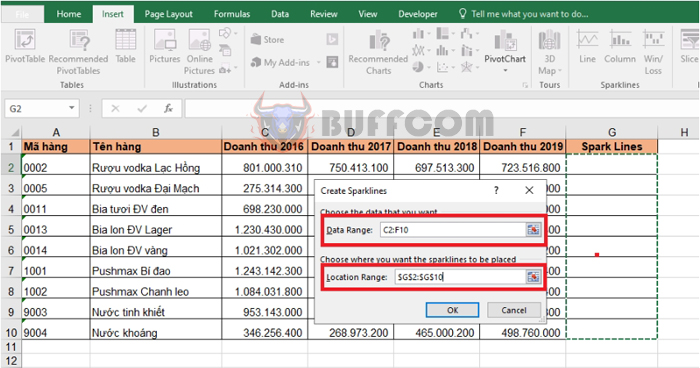
Step 2: After the Create Sparklines dialog box appears, we need to select the data for the following two items:

  • Data Range: select the position of the data to create sparklines. The position of the data in this case is C2:F10.
  • Location Range: select the location of where to place the sparklines. In this case, it is column G, G2:G10.

After you have finished selecting, press OK to complete.

How to create Sparklines to analyze data in Excel

How to create Sparklines to analyze data in Excel

Step 3: After creating, the result we get will be a mini chart analyzing revenue fluctuations over the years in the Sparklines column. You can also choose the color, line style for the sparklines chart under the Style section of the Design tab.

How to create Sparklines to analyze data inTherefore, this article has introduced how to create mini sparklines charts to analyze data in Excel. Hopefully, this article will be helpful to you in your work. Wish you success!

Rate this post
40
260 Views
A great tip for formatting currency units in ExcelPrevA great tip for formatting currency units in ExcelMay 4, 2023
Ways to quickly move data range in ExcelMay 4, 2023Ways to quickly move data range in ExcelNext

Leave a Reply Cancel reply

You must be logged in to post a comment.

Buy Windows 11 Professional MS Products CD Key
Buy Office 2021 Professional Plus Key Global For 5 PC
Top rated products
  • Kaspersky Total Security 2021 1 year 5 devices key Global Kaspersky Total Security 2021 1 year 5 devices key Global
    Rated 5.00 out of 5
    $46.00
  • Avast Premium Security 2021 Avast Premium Security 2021 1 Device 1 Year Global
    Rated 5.00 out of 5
    $11.00
  • Trend Micro Internet Security 3 Devices 1 Year Key GLOBAL Trend Micro Internet Security 3 Devices 1 Year Key GLOBAL
    Rated 5.00 out of 5
    $17.00
  • Windows 11 Pro Key Global Windows 11 Pro Key Global
    Rated 5.00 out of 5
    $6.00
  • AVG Internet Security 2021 10 Devices 2 Years Global AVG Internet Security 2021 10 Devices 2 Years Global
    Rated 5.00 out of 5
    $42.20
Products
  • Windows 10 Home Key Global Windows 10 Home Key Global
    Rated 4.81 out of 5
    $10.00
  • Kaspersky Premium - 1 Device 1 Year - GLOBAL Kaspersky Premium - 1 Device 1 Year - GLOBAL $37.00
  • Kaspersky Total Security 2021 1 year 1 device key Global Kaspersky Total Security 2021 1 year 1 device key Global
    Rated 5.00 out of 5
    $27.00
  • Windows Server 2012 R2 Standard Key Global Windows Server 2012 R2 Standard Key Global
    Rated 4.78 out of 5
    $15.00
  • Microsoft Visio Standard 2021 Key 1PC Microsoft Visio Standard 2021 Key 1PC $13.00
  • Windows 10 Enterprise LTSC 2019 Key Global Windows 10 Enterprise LTSC 2019 Key Global
    Rated 4.83 out of 5
    $9.00
  • Windows Server 2025 Remote Desktop Services 50 User Connections Windows Server 2025 Remote Desktop Services 50 User Connections $25.00
  • Kaspersky Internet Security 2021 1 year 1 device key Global Kaspersky Internet Security 2021 1 year 1 device key Global
    Rated 5.00 out of 5
    $24.00
  • Buy Microsoft Office Professional Plus 2019 CD Key Global - 5 PC Buy Microsoft Office Professional Plus 2019 CD Key Global - 5 PC
    Rated 4.95 out of 5
    $32.00
  • Windows Server 2008 R2 Standard Windows Server 2008 R2 Standard $10.00
Product categories
  • Anti Virus
  • Microsoft Office
  • Microsoft Project
  • Microsoft Visio
  • Microsoft Visual
  • Microsoft Windows
  • Other Software
  • Uncategorized

Buffcom.net always brings the best digital products and services to you. Specializing in Office Software and online marketing services

BIG SALE 50% IN MAY

Microsoft Office
Microsoft Windows
Anti-Virus
Contact Us

Visit Us:

125 Division St, New York, NY 10002, USA

Mail Us:

buffcom.net@gmail.com

TERMS & CONDITIONS | PAYMENT GUIDE  | SHIPPING POLICY  | REFUND POLICY

Copyright © 2019 buffcom.net  All Rights Reserved.