Creating A Report Form In Excel

Creating a report form in Excel is a useful function for both studying and work. It supports you in creating professional and easy-to-read reports. The specific feature used here is PivotTable, which summarizes a large amount of data in a spreadsheet, helping you present scientific and efficient reports. Buffcom.net will help you understand this function more right away!
Learning about PivotTable – Tool to Create Report Form in Excel
Compiling data from a spreadsheet with thousands of pieces of information to create a manual report is impossible for Excel users. Not to mention, it would take a lot of time.
With PivotTable, you can create a report form with features such as:
- Presenting a large amount of user-friendly data, sorted by categories and subcategories, making it easy to search for.
- Supporting functions such as filtering, grouping, sorting, and conditional formatting of data. From there, you can focus on the most appropriate information.
- Expanding or collapsing data levels to delve into the details of any total.
- Creating a concise and attractive report, which is suitable for both online platforms and printing.
So, how do you use PivotTable to create a report form in Excel?
Basic Guide to Creating a Report Form in Excel
To create a report form using PivotTable in Excel, you need to perform the following steps:
Step 1: Open the PivotTable
Select the Insert tab on the Excel Ribbon and click on the PivotTable button.
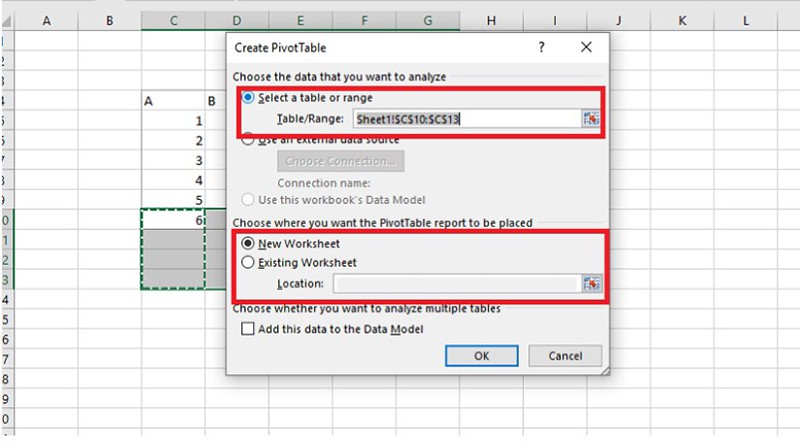
 Then, the Create a PivotTable dialog box will appear on the screen:
Step 2: Select the Location to Create the Report Form in Excel
First, you choose the table or range of data to compile the report, in the Table/Range section:
 Choose where you plan to create a new report form. It can be:
New Worksheet: a new worksheet
Existing Worksheet: an existing worksheet. Then, select the location to publish the report in the Location section:
Step 3: Customize the Report Form in Excel
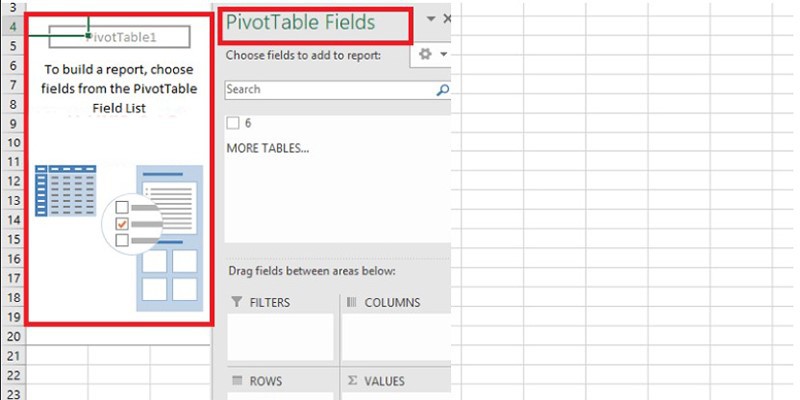
After Step 2, a report form will appear at the destination location. It consists of two parts:
 The area for the report form: displaying the compiled data.
PivotTable Field List: allowing you to select the data fields to display.
After selecting the desired data fields to display, click outside the report form area, and the PivotTable Field List will disappear. The report data format can be adjusted to make it more attractive.
Now you have created a professional and scientific Excel report form. Hopefully, this article will bring you useful information.
In addition, if your work is closely related to Excel but the software cannot meet your needs, contact Buffcom.net for support!


