3 Most Popular Chart Types In Excel

Creating charts is one of the most basic features of Excel, especially essential for those who frequently work with data. There are many types of charts in Excel, but they are basically divided into 3 types: single charts, combination charts, and dynamic charts. Do you know the characteristics of each type of chart? Let’s find out with Buffcom.net!
Single Charts
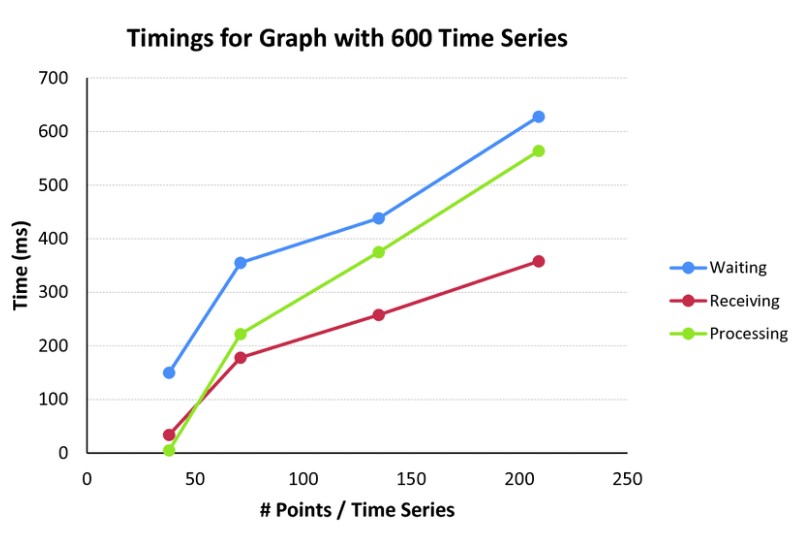
Single chart is the most basic chart type. It is used when displaying only one specific data. It includes single column charts, single pie charts, single line charts, etc.
 Example: If you need to represent the volume of agricultural exports in 12 months, you will use a single column or line chart.
This type of chart is the easiest to read, understand, and draw.
Combination Charts
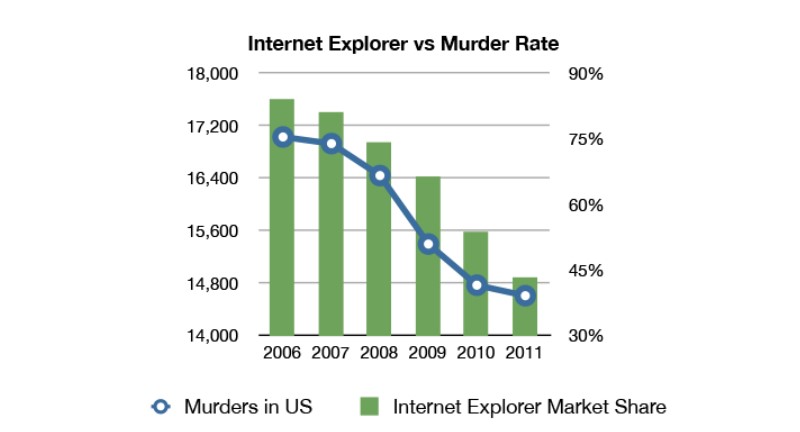
As the name suggests, this type of chart combines multiple single charts together. The most common type is a combination of column and line charts. Combination charts show the correlation between data.
 The combined column and line chart type is used when there are more than 2 data sets with the same unit and 1 data set with a different unit.
Example: A chart representing the number of urban population and the urban population ratio over the years is a combination chart. Because it includes two types of data with different units.
Dynamic Charts
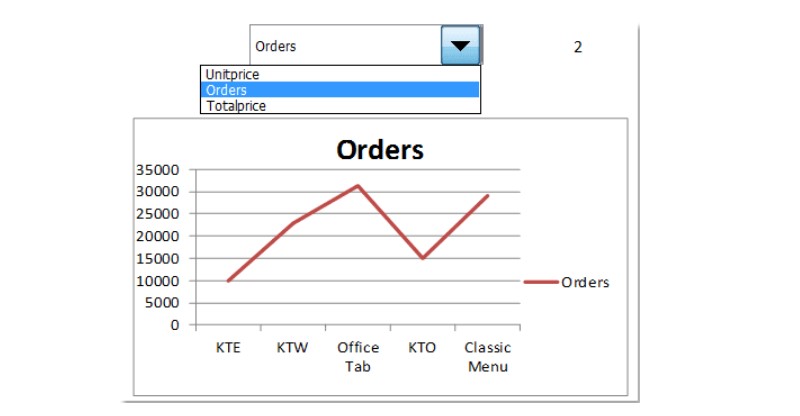
Dynamic charts often show multiple different values of data at different times/positions. It helps to provide visual comparisons of data values based on a certain factor.
 Dynamic charts usually consist of at least two single charts or combination charts. You can choose to display data at each time/position.
Example: A chart representing the number of urban population and the urban population ratio over the years in Ho Chi Minh City and Hanoi. You can use a dynamic chart to visually compare the data of the two cities.
Conclusion
This article has shared about the 3 most popular chart types in Excel. Depending on the purpose, you need to consider choosing the most suitable chart type. We hope this article brings you useful information.
If you want to learn more about chart types in business data analysis, and need full functionality, please contact Buffcom.net for support!


