How to Update Pivot Charts

How to Update Pivot Charts. Pivot charts are charts that are based on pivot reports. Like pivot tables, pivot charts do not automatically update when changes are made to the source data; they need to be refreshed manually.

How to Update Pivot Charts
How to Update Pivot Charts
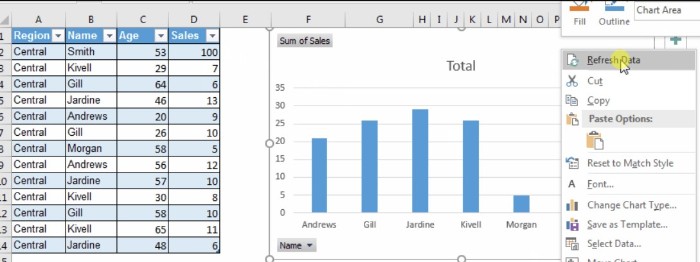
To update a pivot chart, simply right-click on the chart and select “Refresh.” This is the easiest way to refresh a pivot table or chart.
Let’s illustrate this by creating a pivot chart in Excel.

How to Update Pivot Charts
Example: Creating a Pivot Chart and Updating It
- Start with an Excel table containing sales data of employees.
- Select any cell within the data and go to Insert > Pivot Charts (not pivot tables). Insert the pivot chart on the same sheet.
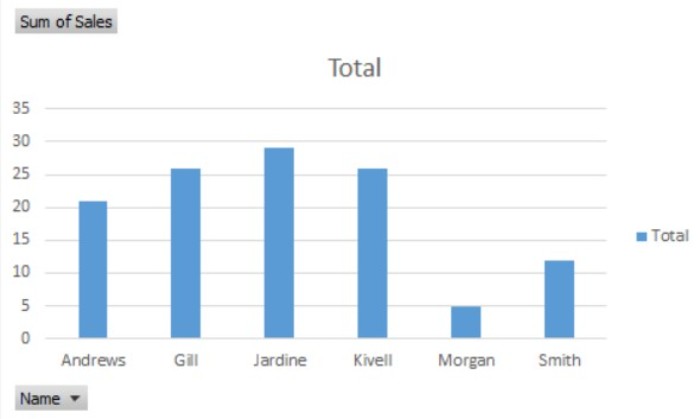
- In the Axis, put the names of employees, and in Values, put the sales data. The pivot chart is now ready.

How to Update Pivot Charts
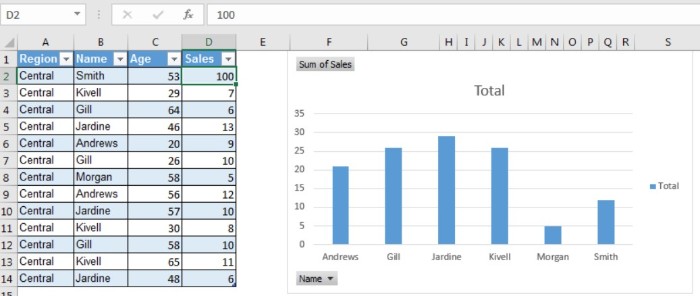
Now, let’s modify some data in the source table by adding 100 sales to Smith.
Despite the change in the source data, you will notice that nothing changes in the pivot chart.
To reflect the updated data in the pivot chart, right-click on the chart and select “Refresh.” Now, you can see the changes you made in the source data reflected in the chart.
How does it work?
Pivot tables and charts store a cache of data. Until the old cache is cleared, the pivot chart will display the previous report. Once the chart is refreshed, the cache is cleared, and new data is stored as the cache.
So, this is how you refresh a pivot chart in Excel. If you have any doubts regarding this article or any other topic related to Excel and VBA, feel free to ask in the comments section.


