• Microsoft Office
  • Microsoft Windows
  • Other Software
    • Microsoft Visual
    • Microsoft Project
    • Microsoft Visio
  • Anti Virus
  • Blog
    • Word
    • Excel
    • Powerpoint
    • Software tricks/tips
  • POLICIES
    • PAYMENT GUIDE
    • SHIPPING POLICY
    • REFUND POLICY
    • TERMS & CONDITIONS
    • Contact Us

No products in the cart.

  • Microsoft Office
  • Microsoft Windows
  • Other Software
    • Microsoft Visual
    • Microsoft Project
    • Microsoft Visio
  • Anti Virus
  • Blog
    • Word
    • Excel
    • Powerpoint
    • Software tricks/tips
  • POLICIES
    • PAYMENT GUIDE
    • SHIPPING POLICY
    • REFUND POLICY
    • TERMS & CONDITIONS
    • Contact Us
Excel

Creating Charts with Floating Up and Down Bars in Excel
0 Comments

In this tutorial, we will learn how to create charts with floating up and down bars in Excel.Down Bars 1
Scenario: When working with charts, we often want to represent data ranges as bars. This can be done by using bar charts or by adding up/down bars to the chart. While bar charts stack data in horizontal bars, changing the orientation of the axis allows us to view the data range in vertical bars. In this tutorial, we will focus on creating a chart with up/down bars. Let’s learn how to solve this problem using any chart type in Excel.

Creating Charts with Floating Up and Down Bars in Excel

How to solve the problem? To achieve this, we will use an attribute of Excel charts called Up/Down bars. This option allows us to display the data range as floating up and down bars in the chart. Floating bars are a great way to compare data ranges within a single chart. Let’s explore how to create an Excel chart with floating bars through the following example and explanation.

Example: To better understand the concept of charts and explore their features, let’s consider an example. We will start by creating a chart and then edit it to represent the data as bars.Down Bars 2
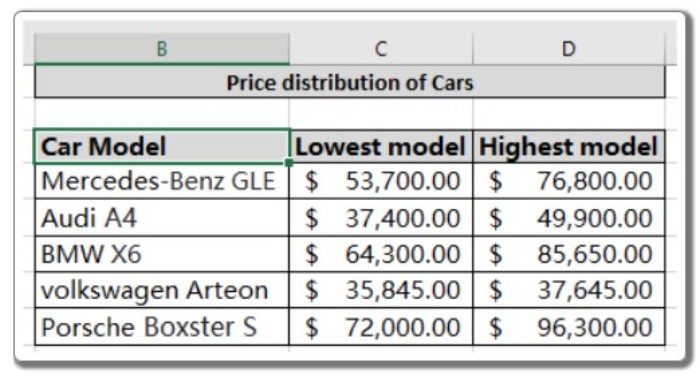
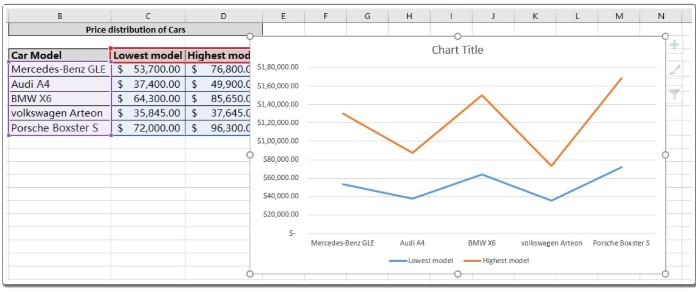
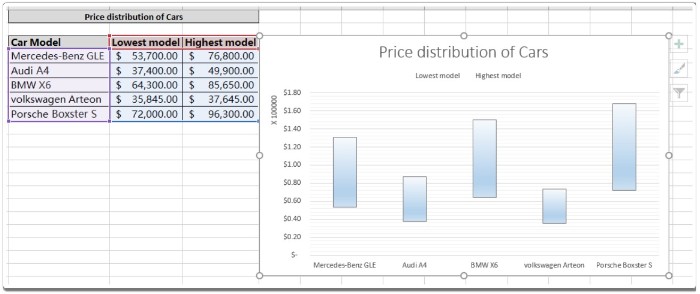
We have data representing the price distribution of cars, which we want to compare with each other. Follow the step-by-step instructions below to create the chart:

  1. Select the data and choose the desired chart type that best represents the data. In this example, we use a line graph with orange and blue lines. The blue line represents the price of the lowest model, while the orange line represents the price of the highest model.Down Bars 3
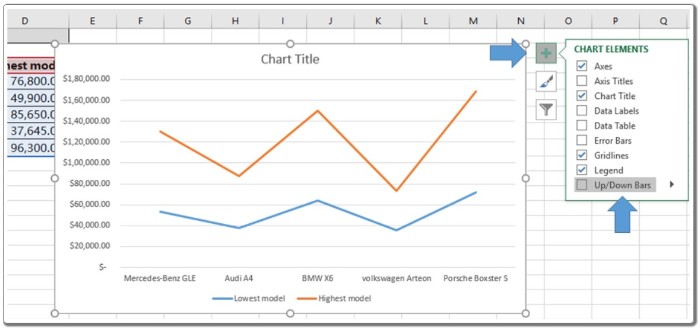
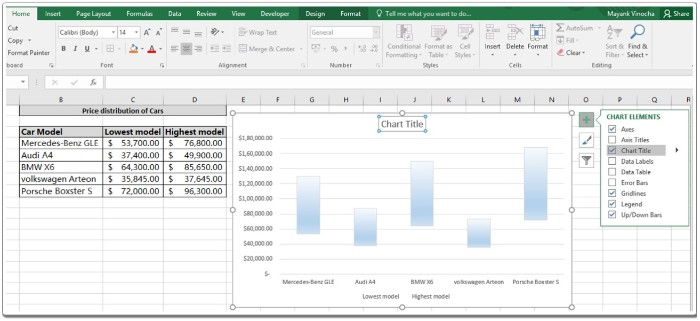
  2. Look for the plus sign (+) located at the top right of the chart. Click on the plus sign to reveal a drop-down list with additional options.
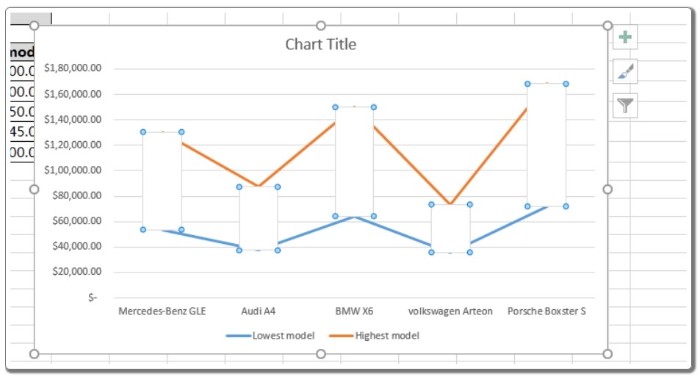
  3. Select the “Up/Down bars” option from the drop-down list. This feature will display the data range as bars, as shown below the chart.Down Bars 4
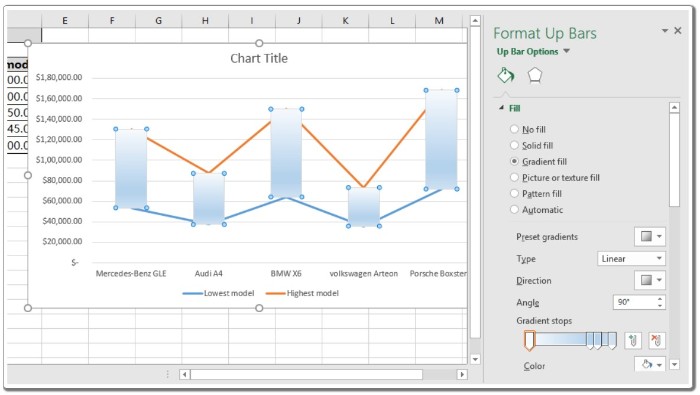
  4. The chart may require some finishing touches. To fill the bars with color, double-click on the bars, as illustrated in the above image. A “Format Up bars” panel will appear on the right side of the sheet.Down Bars 5
  5. Customize the appearance of the up bars by applying different textures or colors from the “Format Up bars” panel.Down Bars 6
  6. If desired, edit the lines in the chart. Double-click on the orange line and select the “No line” option from the “Format Data Series” panel.Down Bars 7
  7. Repeat the same step for the other line, if necessary. Double-click on the blue line and select the “No line” option from the “Format Data Series” panel.
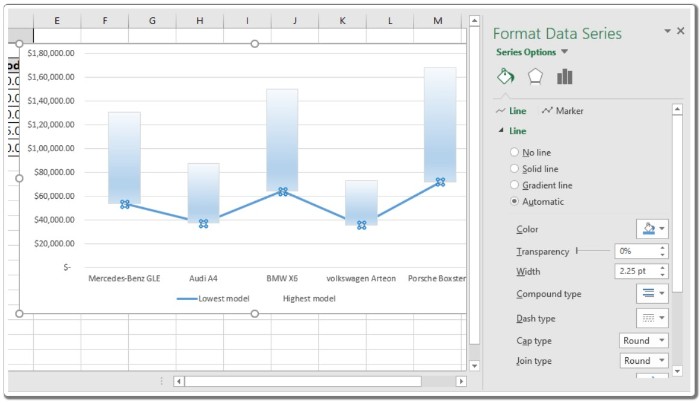
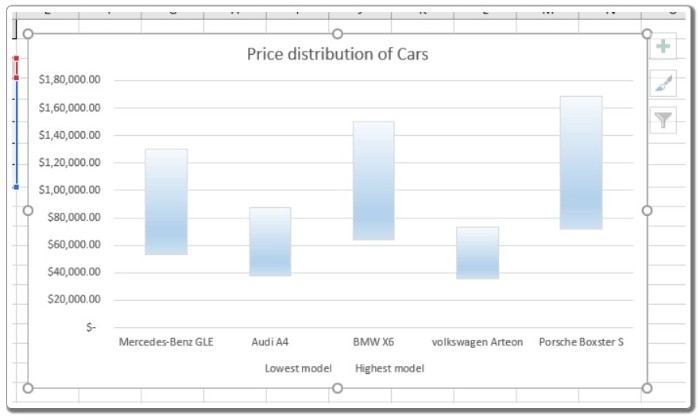
  8. Add a chart title if it hasn’t been added already. Give your chart a name, and your chart with floating up and down bars is ready.Down Bars 8

This is an example of a chart with floating up and down bars, representing the price range for different car models. Customize your chart by applying different texture bars, fill colors, editing background settings, and more.Down Bars 9
 

Rate this post
26
249 Views
You Can Now Send Word Documents to Your KindlePrevYou Can Now Send Word Documents to Your KindleJune 2, 2023
How To Open Control Panel In Windows 10June 3, 2023How To Open Control Panel In Windows 10Next

Leave a Reply Cancel reply

You must be logged in to post a comment.

Buy Windows 11 Professional MS Products CD Key
Buy Office 2021 Professional Plus Key Global For 5 PC
Top rated products
  • Windows 11 Pro Product Activation Key Windows 11 Pro Product Activation Key
    Rated 5.00 out of 5
    $6.00
  • AVG Internet Security 2021 10 Devices 1 Year Global AVG Internet Security 2021 10 Devices 1 Year Global
    Rated 5.00 out of 5
    $30.00
  • Kaspersky Total Security 2021 1 year 1 device key Global Kaspersky Total Security 2021 1 year 1 device key Global
    Rated 5.00 out of 5
    $27.00
  • Avast Ultimate Suite 2021 2 Years 10 Devices Global Avast Ultimate Suite 2021 2 Years 10 Devices Global
    Rated 5.00 out of 5
    $77.00
  • Buy Windows 11 Pro CD Key License Buy Windows 11 Pro CD Key License
    Rated 5.00 out of 5
    $6.00
Products
  • Microsoft SQL Server 2019 Enterprise Microsoft SQL Server 2019 Enterprise $39.00
  • Windows Server 2012 R2 Datacenter Key Global Windows Server 2012 R2 Datacenter Key Global
    Rated 4.71 out of 5
    $15.00
  • Microsoft Office Home And Business 2016 For Mac Key Global Bind Microsoft Account Microsoft Office Home And Business 2016 For Mac Key Global Bind Microsoft Account
    Rated 4.92 out of 5
    $15.00
  • AVG Ultimate 2021 with Antivirus + Cleaner, Secure VPN 10 Devices 1 Year AVG Ultimate 2021 with Antivirus + Cleaner, Secure VPN 10 Devices 1 Year
    Rated 4.91 out of 5
    $34.00
  • Windows 10 Pro Key Global Windows 10 Pro Key Global
    Rated 4.74 out of 5
    $6.00
  • Microsoft Visual Studio Enterprise 2019 For 1 PC Microsoft Visual Studio Enterprise 2019 For 1 PC
    Rated 4.88 out of 5
    $15.00
  • Windows Server 2012 Remote Desktop Services 50 USER Connections Key Global Windows Server 2012 Remote Desktop Services 50 USER Connections Key Global
    Rated 4.69 out of 5
    $25.00
  • Project Professional 2013 Microsoft Project Professional 2013 - 1 PC $9.00
  • Windows Server 2016 Datacenter Key Global Windows Server 2016 Datacenter Key Global
    Rated 4.74 out of 5
    $10.00
  • SQL Server 2019 Standard SQL Server 2019 Standard $20.00
Product categories
  • Anti Virus
  • Microsoft Office
  • Microsoft Project
  • Microsoft Visio
  • Microsoft Visual
  • Microsoft Windows
  • Other Software
  • Uncategorized

Buffcom.net always brings the best digital products and services to you. Specializing in Office Software and online marketing services

BIG SALE 50% IN MAY

Microsoft Office
Microsoft Windows
Anti-Virus
Contact Us

Visit Us:

125 Division St, New York, NY 10002, USA

Mail Us:

buffcom.net@gmail.com

TERMS & CONDITIONS | PAYMENT GUIDE  | SHIPPING POLICY  | REFUND POLICY

Copyright © 2019 buffcom.net  All Rights Reserved.