How to make a quick and professional report in Excel
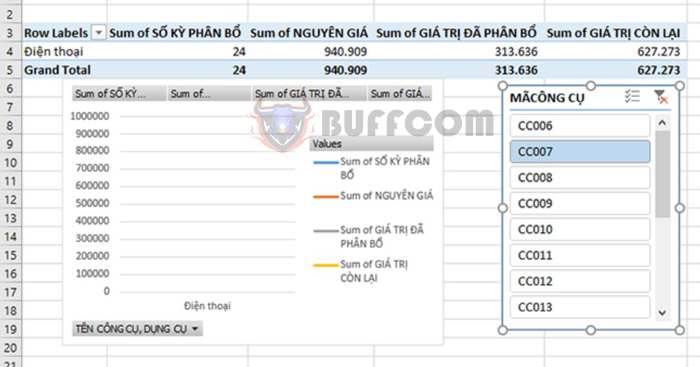
One of the common requirements in Excel is to create a report. In addition to the need for a summary report, in many cases, we also need to extract some detailed content from the data table. This is the process of creating a detailed report. In this article, Buffcom.net will guide you through 3 steps to create a professional report in Excel.
Step 1: Create a PivotTable
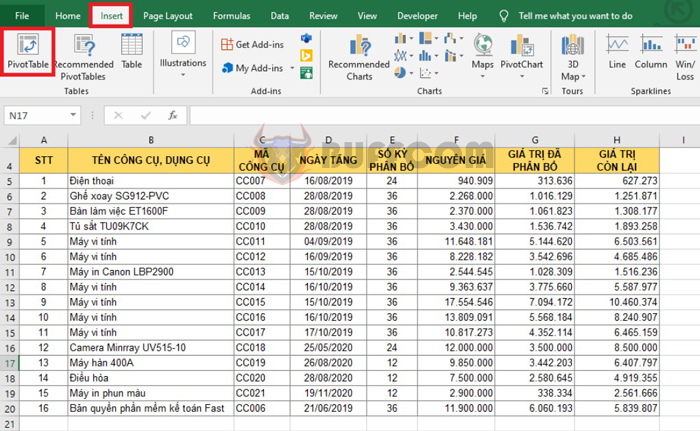
For example, we have a data table as shown below. To create a PivotTable, first, you need to place the mouse pointer on any cell in the data area. Then, select the Insert tab on the toolbar and click on PivotTable in the Tables section.
How to make a quick and professional report in Excel
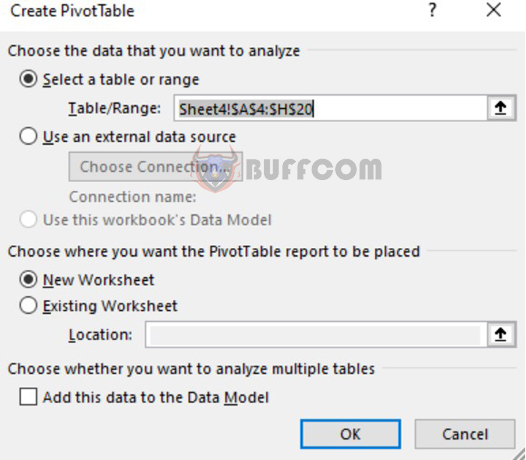
At this point, the Create PivotTable dialog box appears. In the Table/Raunge field, the data area address will be displayed. Choose where you want the PivotTable report to be placed in:
- New Worksheet: place in a new sheet.
- Existing Worksheet: place in the current sheet. If you choose this option, you need to choose the location to place the PivotTable in the Location field.
Finally, click OK to create the PivotTable.
How to make a quick and professional report in Excel
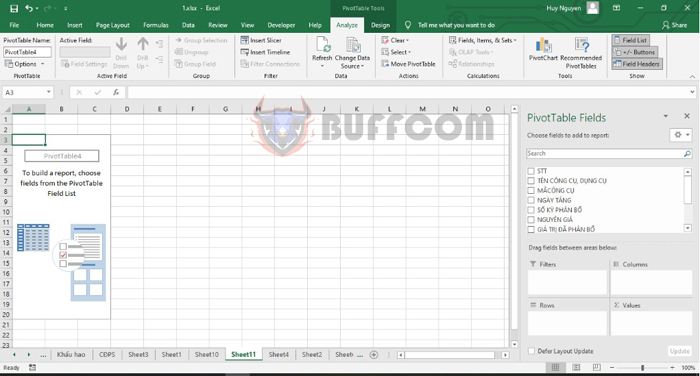
After clicking OK, the PivotTable Fields window appears on the right side of the screen. This section has 2 parts:
– Choose fields to add to report: select data fields to add to the PivotTable report,
– Drag fields between areas below: 4 areas to drop selected data fields from the Choose fields to add to report section
- Filter: data filtering area
- Columns: column names
- Rows: row names
- Values: values to display
How to make a quick and professional report in Excel
Step 2: Insert a chart
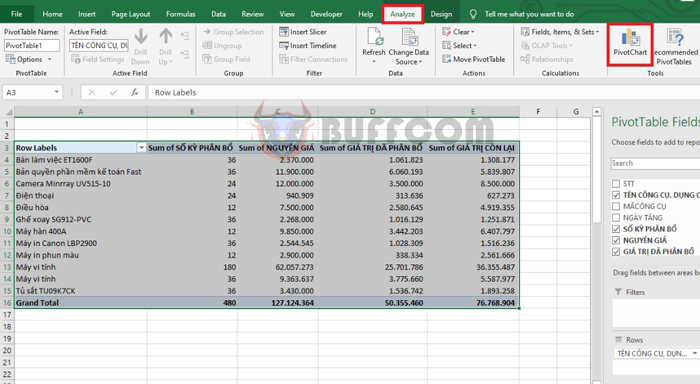
Next, you need to insert a chart by selecting the entire PivotTable data table. Then, select the Analyze tab => PivotChart.
How to make a quick and professional report in Excel
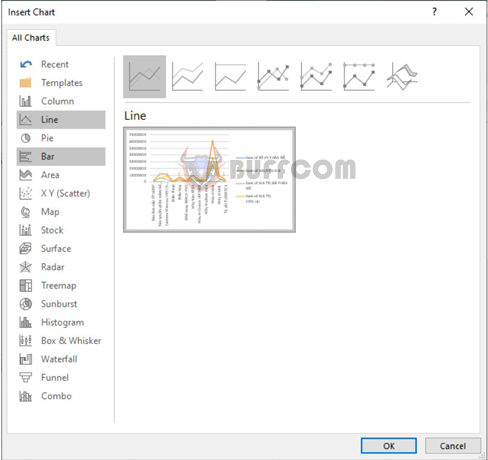
At this point, the Insert Chart dialog box appears. Select a chart you want to create and click OK.
How to make a quick and professional report in Excel
Step 3: Insert a Slicer
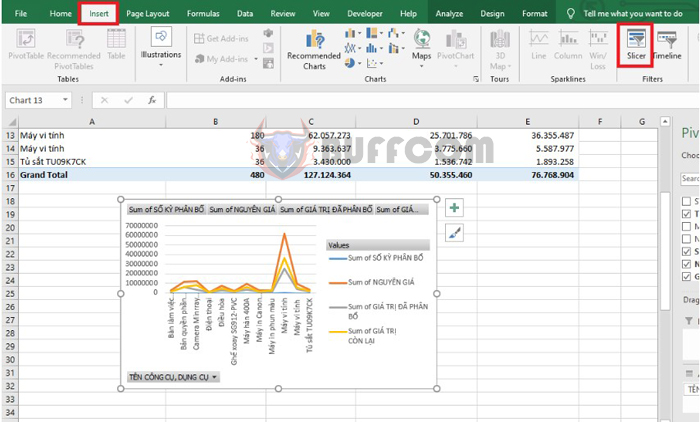
After successfully creating the chart, select the chart and select the Insert tab => Slicer.
How to make a quick and professional report in Excel
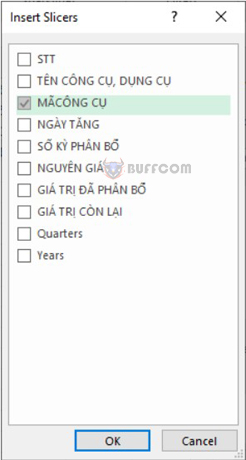
At this point, the Insert Slicers dialog box will appear. Check the content you want to analyze and click OK.
How to make a quick and professional report in Excel
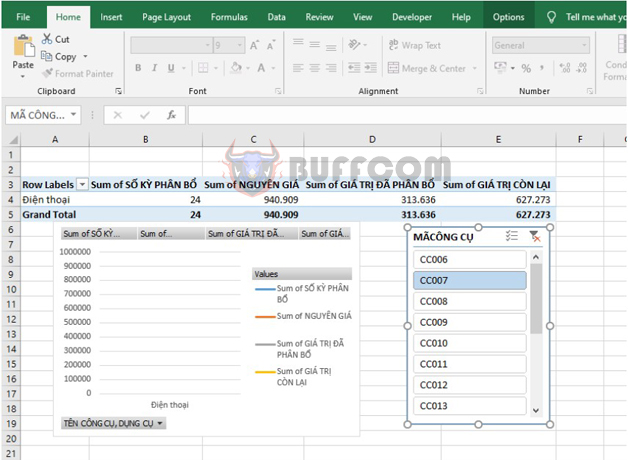
That’s all you need to do. The list of content you want to analyze will appear. You just need to click on an item in that list and the chart will automatically switch to analyze the data of that item quickly.
How to make a quick and professional report in Excel
Thus, this article has guided you through 3 steps to create a professional report in Excel. Hopefully, this article will be helpful to you in the working process. Wish you success!


