Repair Log Report by John

Repair Log Report by John. This article provides instructions on how to create a repair log report in Microsoft Excel 2010 and 2013.
Repair Log Report by John
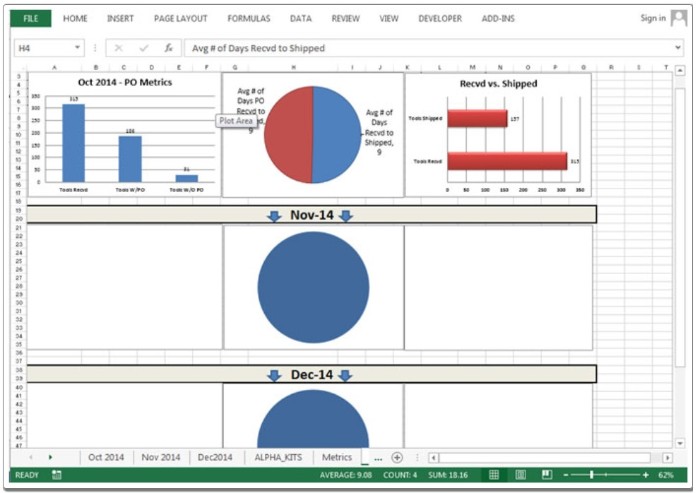
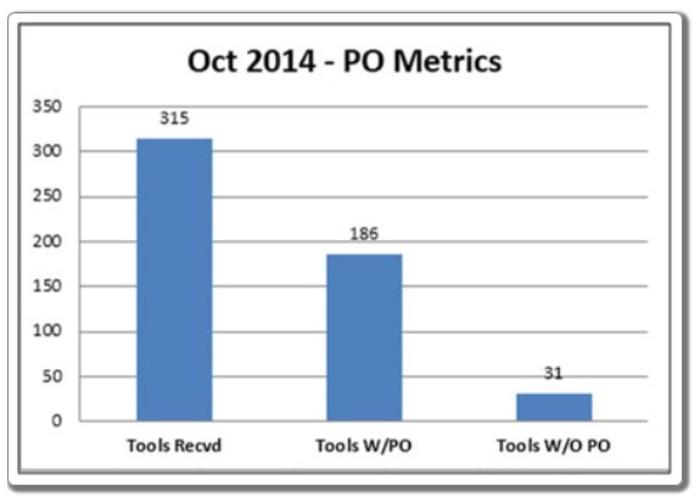
Chart: PO Metrics
A column chart is used to display PO metrics, showing the numbers for Tools Received, Tools with PO, and Tools without PO on a monthly basis. According to the chart, Tools Received is 315, Tools with PO is 186, and Tools without PO is 31.
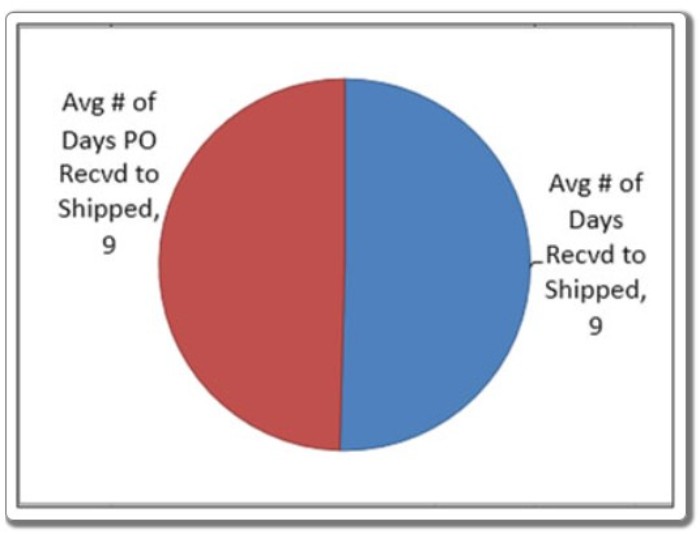
Chart: Average Days of PO Received to Shipped
A pie chart is used to illustrate the average number of days between PO receipt and shipment.
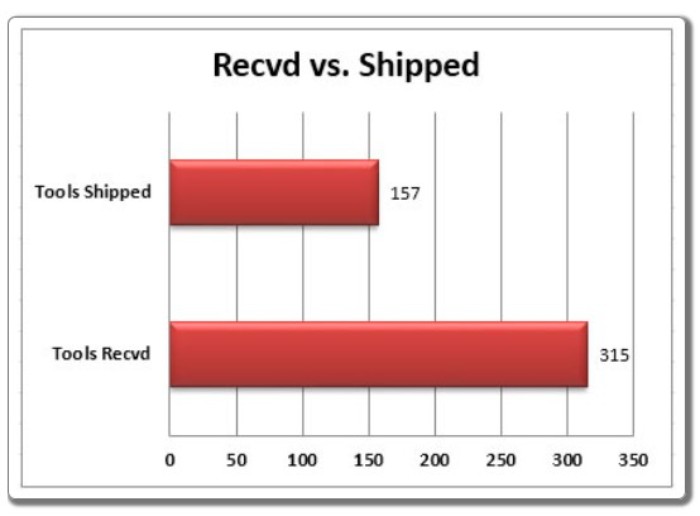
Chart: Received vs. Shipped
A bar chart is used to compare the number of items received versus the number of items shipped. The chart indicates that the total received is 315, and the total shipped is 157.
The Matrix tab provides a summary of data including: total tools received, total tools shipped, total repairs received with PO, percentage of total tools with PO, total repairs received without PO, percentage of total tools without PO, total items with back-ordered parts, percentage of total with back-orders, average number of days to receive back-ordered parts, average number of days to ship from the received date, and average number of days to ship from the PO received date.


