• Microsoft Office
  • Microsoft Windows
  • Other Software
    • Microsoft Visual
    • Microsoft Project
    • Microsoft Visio
  • Anti Virus
  • Blog
    • Word
    • Excel
    • Powerpoint
    • Software tricks/tips
  • POLICIES
    • PAYMENT GUIDE
    • SHIPPING POLICY
    • REFUND POLICY
    • TERMS & CONDITIONS
    • Contact Us

No products in the cart.

  • Microsoft Office
  • Microsoft Windows
  • Other Software
    • Microsoft Visual
    • Microsoft Project
    • Microsoft Visio
  • Anti Virus
  • Blog
    • Word
    • Excel
    • Powerpoint
    • Software tricks/tips
  • POLICIES
    • PAYMENT GUIDE
    • SHIPPING POLICY
    • REFUND POLICY
    • TERMS & CONDITIONS
    • Contact Us
Excel

Using PivotTable for Reporting and Statistics in Excel

0 Comments

Using PivotTable for Reporting and Statistics in Excel:PivotTable is a very useful tool in Excel that can help you quickly perform tasks such as filtering data, creating reports, and generating statistics. In other words, PivotTable is a tool that helps us analyze data according to specific requirements. This article from Buffcom.net will share with you detailed instructions on how to use PivotTable in Excel.

Step 1: To create a PivotTable.

First place the mouse cursor in any cell in the data area. Then select the Insert tab on the toolbar and click on PivotTable in the Tables section.

Using PivotTable for Reporting and Statistics in Excel

Using PivotTable for Reporting and Statistics in Excel

Step 2: At this point, the Create PivotTable dialog box will appear.

In the Table/Range field, the address of the data range will be displayed. Choose where you want the PivotTable report to be placed in the Choose where you want the PivotTable report to be placed section.

New Worksheet: Place in a new sheet.
Existing Worksheet: Place in the current sheet. If you choose this option, you need to select the location to place the PivotTable in the Location field.
Finally, click OK to create the PivotTable.

Using PivotTable for Reporting and Statistics in Excel

Using PivotTable for Reporting and Statistics in Excel

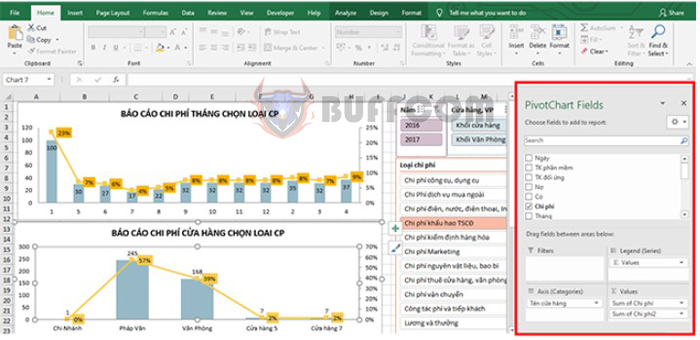
Step 3: After clicking OK, Excel will display the PivotTable Fields window on the right side of the screen. This section has two parts:

– Choose fields to add to report: select data fields to add to the PivotTable report,

– Drag fields between areas below: 4 areas to drop selected data fields from the Choose fields to add to report section.

  • Filter: data filtering area
  • Columns: column names
  • Rows: row names
  • Values: values to display

For example, if you need to filter the total amount of debit and credit transactions by each customer, simply tick the Name, Debit, and Credit boxes. This way, you will have a summary table of transactions by customer quickly.

Using PivotTable for Reporting and Statistics in Excel

Using PivotTable for Reporting and Statistics in Excel

Alternatively, if you need to filter by account for each corresponding party, you need to tick the Account, Corresponding party, Debit, and Credit boxes. This way, you will have a summary table of Debit and Credit by account and corresponding party quickly. You can also move the Debit or Date box to the COLUMNS area by clicking and dragging it to the COLUMNS area. Or click and select Move to Column Labels to make the table more readable.

Using PivotTable for Reporting and Statistics in Excel

Using PivotTable for Reporting and Statistics in Excel

By following the steps outlined in this article, you can easily create reports and statistics that meet your specific requirements. PivotTable can save you time and effort when working with large datasets, making it an essential tool for data analysis in Excel. We hope that this guide has been helpful to you, and wish you success in your work.

Rate this post
25
278 Views
How to quickly find the maximum and minimum values in an Excel data tablePrevHow to quickly find the maximum and minimum values in an Excel data tableMarch 4, 2023
How to Sum Same Codes in ExcelMarch 6, 2023How to Sum Same Codes in ExcelNext

Leave a Reply Cancel reply

You must be logged in to post a comment.

Buy Windows 11 Professional MS Products CD Key
Buy Office 2021 Professional Plus Key Global For 5 PC
Top rated products
  • Kaspersky Internet Security 2021 1 year 5 devices key Global Kaspersky Internet Security 2021 1 year 5 devices key Global
    Rated 5.00 out of 5
    $45.00
  • Windows Server 2022 Datacenter Key Global Windows Server 2022 Datacenter Key Global
    Rated 5.00 out of 5
    $7.00
  • Kaspersky Small Office Security 10 PCs + 10 Mobiles + 1 Server 1 Year Kaspersky Small Office Security 10 PCs + 10 Mobiles + 1 Server 1 Year
    Rated 5.00 out of 5
    $164.50
  • Avast Ultimate Suite 2021 1 Year 10 Devices Global Avast Ultimate Suite 2021 1 Year 10 Devices Global
    Rated 5.00 out of 5
    $54.00
  • Windows 11 Pro Key Global Windows 11 Pro Key Global
    Rated 5.00 out of 5
    $6.00
Products
  • Trend Micro Maximum Security 3 Devices 1 Year key Global Trend Micro Maximum Security 3 Devices 1 Year key Global
    Rated 5.00 out of 5
    $15.00
  • Buy Windows 11 Professional MS Products CD Key Buy Windows 11 Professional MS Products CD Key
    Rated 5.00 out of 5
    $6.00
  • Windows Server 2025 Remote Desktop Services 50 Device Connections Windows Server 2025 Remote Desktop Services 50 Device Connections $25.00
  • Project Professional 2013 Microsoft Project Professional 2013 - 1 PC $9.00
  • Windows 10 Pro Key Global Genuine Key Windows 10 Pro Key Global Genuine Key
    Rated 4.78 out of 5
    $6.00
  • Avast SecureLine VPN 2021 1 Year 5 Devices Global Avast SecureLine VPN 2021 1 Year 5 Devices Global
    Rated 4.91 out of 5
    $34.00
  • Windows Server2008 R2 Remote Desktop Services device connections (20)cal Windows Server2008 R2 Remote Desktop Services device connections (20)cal $29.00
  • Windows 10 Pro N Key Global Windows 10 Pro N Key Global
    Rated 4.83 out of 5
    $10.00
  • Office 2024 Home and Student Office 2024 Home and Student $88.00
  • Project Standard 2021 Microsoft Project Standard 2021 - 1 PC $13.00
Product categories
  • Anti Virus
  • Microsoft Office
  • Microsoft Project
  • Microsoft Visio
  • Microsoft Visual
  • Microsoft Windows
  • Other Software
  • Uncategorized

Buffcom.net always brings the best digital products and services to you. Specializing in Office Software and online marketing services

BIG SALE 50% IN MAY

Microsoft Office
Microsoft Windows
Anti-Virus
Contact Us

Visit Us:

125 Division St, New York, NY 10002, USA

Mail Us:

buffcom.net@gmail.com

TERMS & CONDITIONS | PAYMENT GUIDE  | SHIPPING POLICY  | REFUND POLICY

Copyright © 2019 buffcom.net  All Rights Reserved.