New Excel features you shouldn’t miss

New Excel features you shouldn’t miss. Recently, Microsoft introduced some very interesting new features to Excel. Let’s take a look at each function and feature, and how you can use them to better analyze and calculate your data in Excel features.
1. Excel features – Text function
For: Excel features for Web & Office 365
The new TEXTBEFORE and TEXTAFTER functions make it easier to extract text strings from a cell. TEXTBEFORE returns text before the expected separator, while TEXTAFTER returns text after it. Another interesting addition is the TEXTSPLIT function, which allows you to split text into multiple rows or columns.
2. New Excel – Array functions
For: Excel for Web & Office 365
Combine multiple dynamic arrays
New Excel features you shouldn’t miss
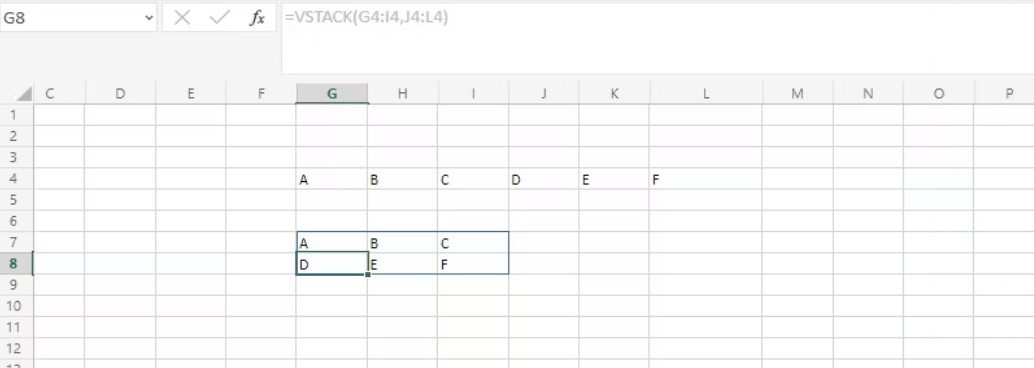
You can use the new VSTACK and HSTACK functions to combine multiple dynamic arrays vertically or horizontally.
Convert 2D arrays to lists and vice versa
Use the TOROW function to convert a 2D array to a row and the TOCOL function to convert an array to a column. In addition, you can use the WRAPROWS and WRAPCOLS functions to convert a row or column to an array after reaching a set size (height or width).
Keep or remove rows/columns
The TAKE and DROP functions allow you to keep or remove certain rows or columns that have been set (from the beginning or end). But if you want to fetch specific rows or columns from a dynamic array, you can use the CHOOSEROWS or CHOOSECOLS functions.
Expand dynamic arrays
Excel has also introduced the EXPAND function to help you expand dynamic arrays. You can not only specify the size of the new array, but also specify a value to fill inside the new cells.
3. Excel features – Group Operations in Power Query
Available for: Excel for Web & Office 365 (Business or Enterprise package)
There are many compelling reasons to use Power Query in Excel: Power Query allows you to import and integrate data from external sources. You can then perform various operations on it to extract valuable detailed information while still maintaining the original source(s).
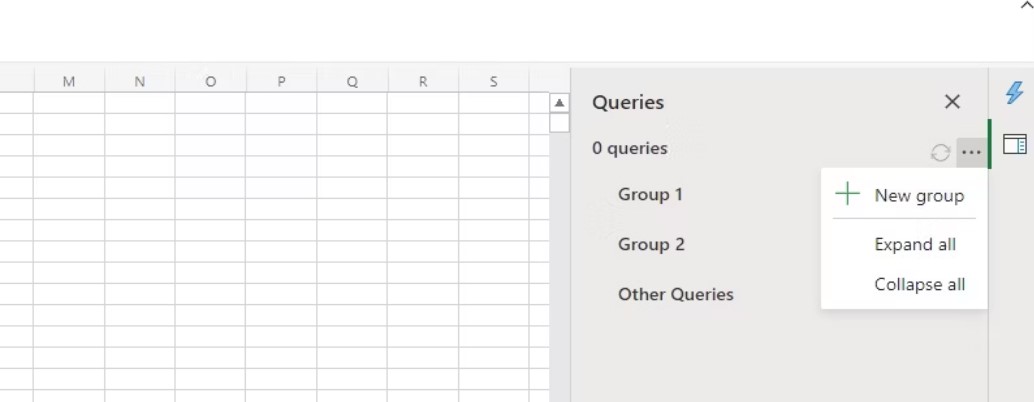
The new additions to Power Query group operations make sorting and analyzing data on the Query pane much more convenient and efficient.
New Excel features you shouldn’t miss
Now, you can group queries together, helping you perform operations on multiple queries (of the same group) with just one click. For example, by refreshing a group, you can refresh all queries within the group. Furthermore, Excel now allows you to organize Power Query groups more efficiently. You can move a query or group into another group or remove some queries from a group. Similarly, you can simultaneously expand or collapse all Power Query groups. Overall, these new features make Excel features a much more powerful tool for data analysis and manipulation.
4. Improvements to Excel and Power BI Connection
Available: Excel for Web & Windows Insider (Beta Channel 2208)
In Excel, you can create PivotTables and connect them to Power BI data sets for visual data analysis. To analyze more effectively, Excel has introduced two new improvements:
Date and time are now date and time objects instead of strings. That means you can sort data from oldest to newest or vice versa.
PivotTables connected to Power BI now support drag-and-drop aggregation. Previously, you had to create measures to analyze data.
5. Inserting Images into Cells
Available: Windows, Mac, iOS, and Android Insider
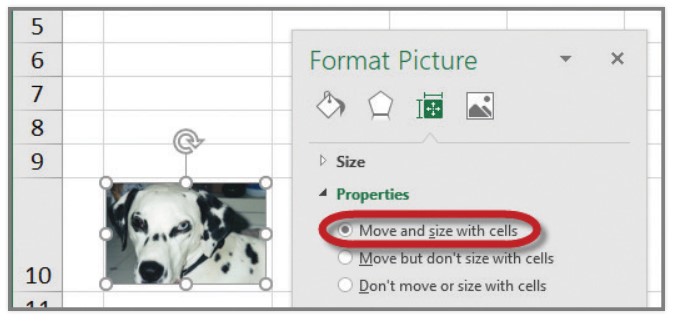
Excel’s new image feature allows you to return an image inside an Excel cell. Previously, when you inserted an image into your spreadsheet, it would hover over the cells. Because the new image feature returns the image directly into the cell, adjusting the spreadsheet and moving cells will not affect the image. You only need to enter the source location in the image formula to get the image. The formula also allows you to enter alternative text and specify image size.
New Excel features you shouldn’t miss

