How to Utilize Insights in Excel and Considerations to Keep in Mind
How to Utilize Insights in Excel and Considerations to Keep in Mind. Insights in Excel, a new feature for Office 365 subscribers, is being gradually rolled out by Microsoft. This tool, previously available in preview for participants of the Office Insiders program, is now accessible to all users. It leverages cloud-based artificial intelligence and machine learning to uncover hidden information and patterns in your Excel data sets that you may have overlooked.
How to Utilize Insights in Excel and Considerations to Keep in Mind
Once Insights is installed, accessing it is as simple as clicking a designated button on the Office Ribbon. However, extracting useful information from the tool can be a bit challenging. Insights showcases the potential of artificial intelligence but also highlights the difficulties in effectively applying it in practice.
This concise tutorial explains how to apply Insights and sheds light on the challenges that may arise when employing artificial intelligence with real-world data sets.
Applying Insights in Excel:
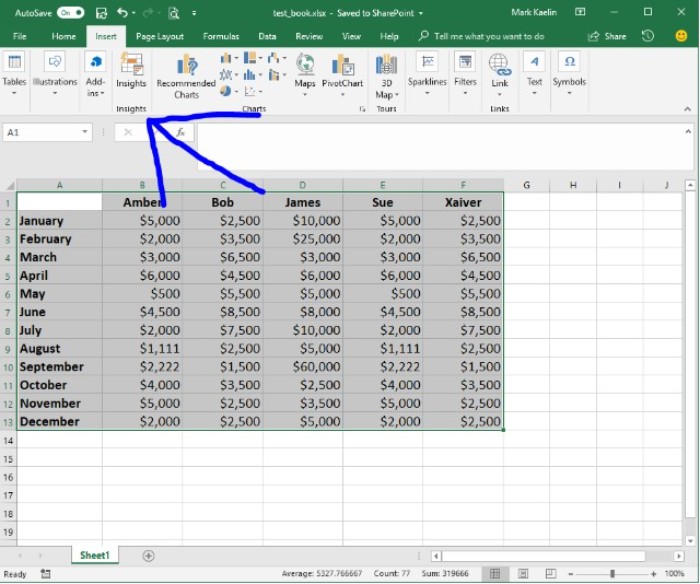
To utilize Insights, select your data set in Excel (you can label it if you prefer) and navigate to the Insert tab on the Office Ribbon. Click the Insights button, typically positioned in the middle of the Ribbon (Figure A).
How to Utilize Insights in Excel and Considerations to Keep in Mind
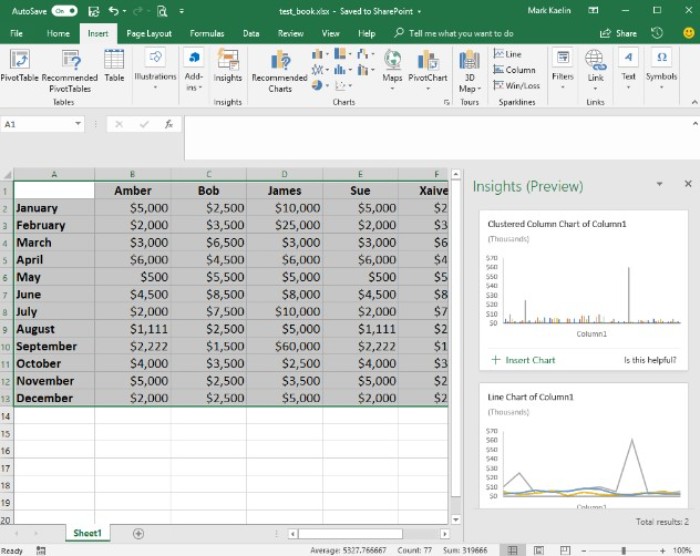
Upon clicking the Insights button, Excel will take a moment to analyze the data set and then present you with various graphical options (Figure B). The range and quality of these options will depend on the data being analyzed. In our simple example, the choices are quite basic and not particularly revealing.
How to Utilize Insights in Excel and Considerations to Keep in Mind
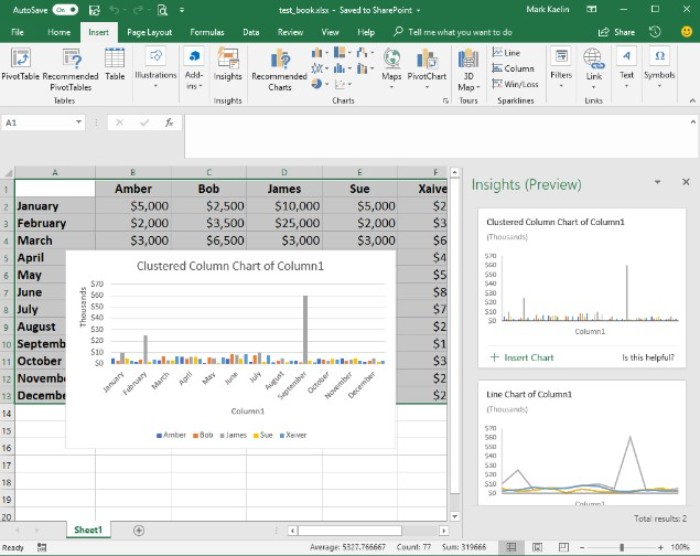
If you find a graph that meets your requirements, you can click the Insert Chart link, and the chart will be inserted into your workbook with a basic yet presentable format (Figure C).
How to Utilize Insights in Excel and Considerations to Keep in Mind
Considerations and Limitations:
It’s important to note that Insights performs best with clean, well-organized data that doesn’t contain nested elements or blank rows and columns. Additionally, this tool cannot be used on data that has been converted into a Pivot table. Microsoft suggests that Insights works most effectively with data formatted as an Excel Table (Figure D).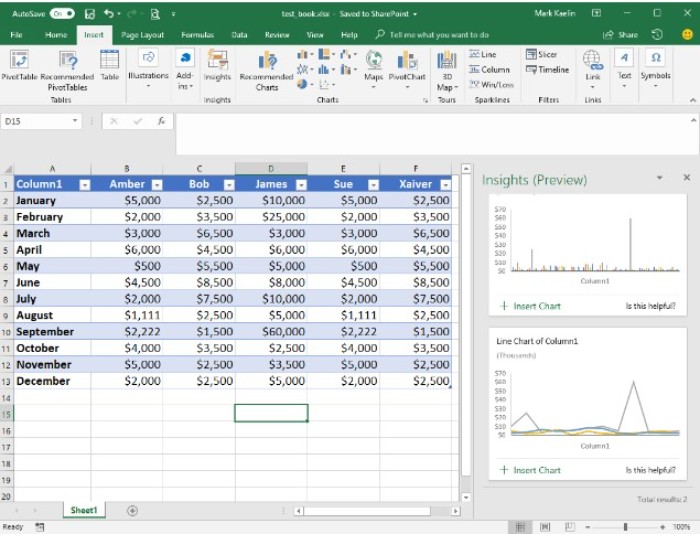
To format a data set as an Excel Table, highlight the data and use the CTRL-T keyboard shortcut. Although in our example, converting to table format didn’t offer additional chart choices or reveal hidden patterns, it may be more effective with a more complex table.
Herein lies the challenge with Insights and other AI or machine learning tools—they don’t always deliver the expected results. Advocates of these technologies often exaggerate their capabilities. I tested Insights on several real Excel data sets, but the tool couldn’t generate even a single chart.
Let’s examine our sample data set. It’s evident that James is associated with several significant activity spikes, which the charts reveal. However, did we really need Insights to identify this? Moreover, the tool cannot explain why the activity spiked. That analysis remains the responsibility of a human, as AI cannot assist in that aspect.
As AI tools become more prevalent and the hype around them grows, it’s crucial to recognize their limitations in practical settings. While AI can provide clues to patterns or solutions, understanding the meaning and significance of those patterns will still rely on human interpretation for the foreseeable future.


