How to Debug Your Code with Microsoft Visual Studio 2022
Debugging is an essential part of software development, helping you identify and fix issues in your code. Unity supports various code editors, including Microsoft Visual Studio, which is one of the most robust and feature-rich options available. This article will guide you through the process of using the Microsoft Visual Studio 2022 debugger to debug your Unity projects effectively.
Installing Visual Studio 2022 Debugging Tools
Visual Studio 2022 comes with built-in support for Unity, offering tools that streamline the process of writing, editing, and debugging scripts. Features like IntelliSense, syntax highlighting, and code snippets help speed up coding, while debugging tools allow you to set breakpoints, step through code, inspect variables, and evaluate expressions during runtime.
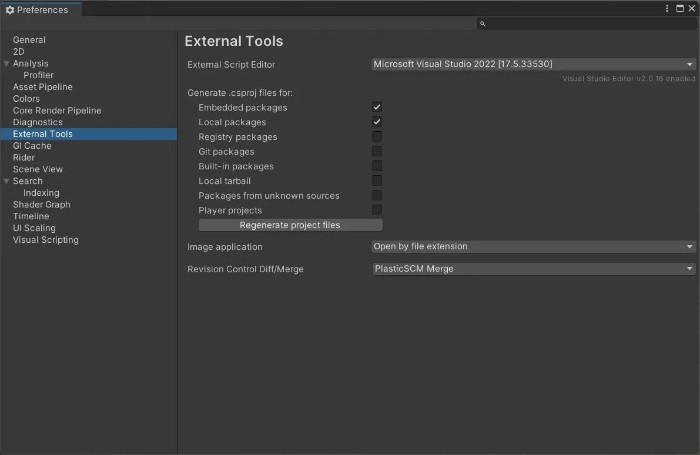
When you install Unity, the Community version of Visual Studio is typically installed along with it, complete with an extension called “Game Development with Unity” that integrates Visual Studio with Unity. If you haven’t installed Visual Studio or need to reinstall it, you can download it here. After installation, set Visual Studio as your preferred external script editor by navigating to Unity > Preferences > External Tools and selecting Visual Studio.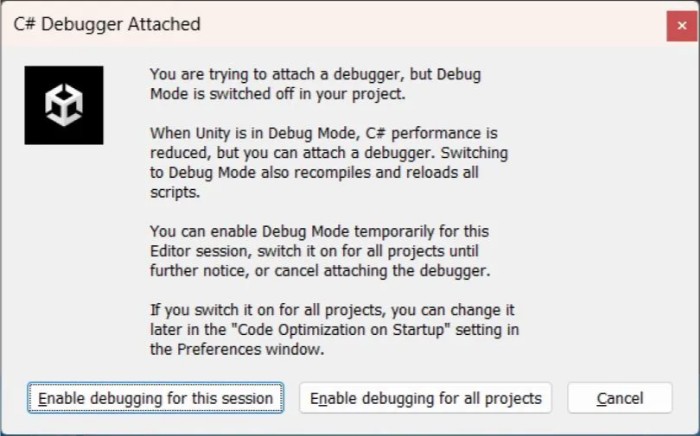
Attaching the Visual Studio Debugger to Unity
To debug your code while your game runs in the Unity Editor, you need to attach the Visual Studio debugger to Unity. This allows you to inspect and interact with your game’s runtime state in real-time.
- Open your Unity project.
- Go to Edit > Preferences (Windows) or Unity > Preferences (macOS) in Unity, and ensure that Visual Studio is set as the external script editor.
- Open the script you want to debug by double-clicking it in the Unity Project view or via Assets > Open C# Project.
- In Visual Studio, go to Debug > Attach Unity Debugger or click the “Attach to Unity” button in the toolbar.
- A window will appear showing available Unity instances. Select the instance associated with your project (usually listed as “Unity Editor (your project name)”) and click Attach.
Now, Visual Studio is connected to Unity, and you can begin setting breakpoints and debugging your code. When your game is running in the Editor, Visual Studio will pause execution at breakpoints, allowing you to examine the game state and debug your code.
Using Breakpoints
Breakpoints are markers that pause the execution of your program at a specific line of code. This pause allows you to inspect variables, objects, and the call stack, and step through the code line by line.
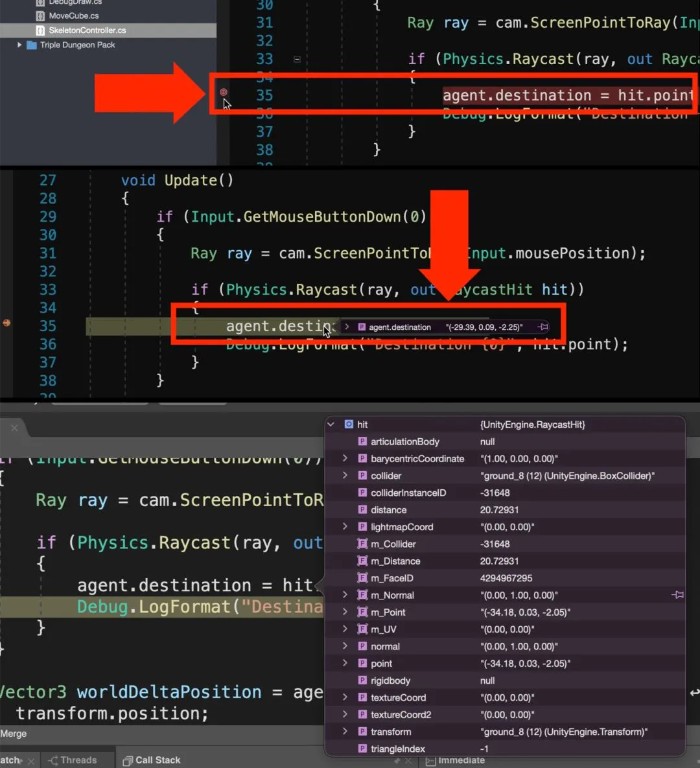
- To set a breakpoint in Visual Studio, click in the left margin next to the line of code where you want to pause execution, or place the cursor on the line and press F9. A red dot will appear, indicating the breakpoint.
- Play your game in the Unity Editor. When the execution reaches the line with the breakpoint, Visual Studio will become the active application, and the execution will pause at the breakpoint line. You can now use Visual Studio tools to inspect variables.

Conditional Breakpoints
Conditional breakpoints allow you to pause execution only when a specific condition is met, which is useful for debugging scenarios that occur under certain conditions.
- To set a conditional breakpoint, right-click on an existing breakpoint and select Edit Breakpoint. A dialog box will appear, allowing you to enter the condition that must be true for the breakpoint to trigger.
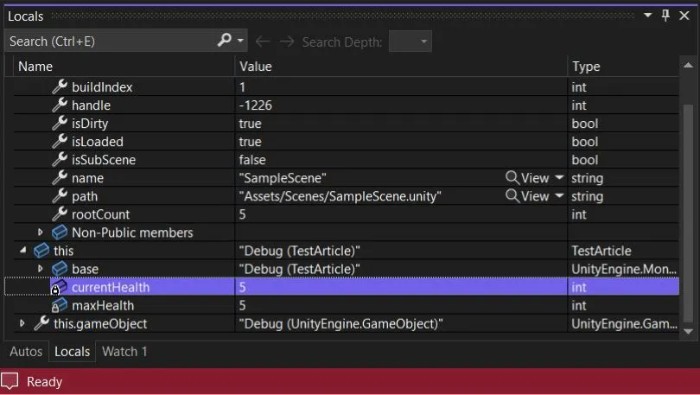
Inspecting Variables: Locals and Watch Windows
- Locals Window: Displays local variables and their values in the current scope of the executing code, including variables declared within the current method or block. This window helps quickly identify incorrect or unexpected values causing issues in your code.
- Watch Window: Allows you to track specific variables or expressions throughout the execution of your program. Unlike the Locals window, which is limited to the current scope, the Watch window lets you manually add variables or expressions, providing a broader view of the state of your program.
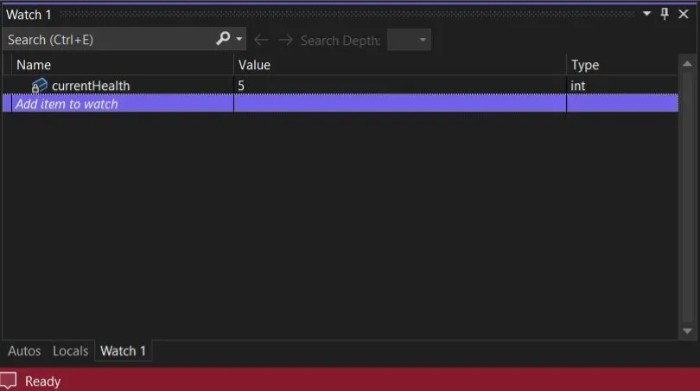
How to Debug Your Code with Microsoft Visual Studio 2022
Debugging a Build
Debugging in Visual Studio isn’t limited to the Unity Editor. You can also debug a build of your game. This is particularly useful for finding issues that may only occur in the final build.
- Build your game as usual through Unity.
- Once the build is complete, go to Debug > Attach to Process in Visual Studio.
- Select your game’s executable from the list and click Attach.
- You can now debug your build in the same way you would within the Unity Editor.
More Resources for Advanced Unity Creators
Debugging is just one aspect of game development. For more advanced techniques and resources, explore Microsoft’s extensive documentation and tutorials, as well as Unity’s own resources for improving your development workflow. Whether you’re optimizing performance or diving deep into complex debugging scenarios, there’s always more to learn and improve.
By mastering these debugging tools in Visual Studio 2022, you’ll be well-equipped to tackle even the most challenging bugs in your Unity projects.


