How to use the Outline feature to summarize data in Excel
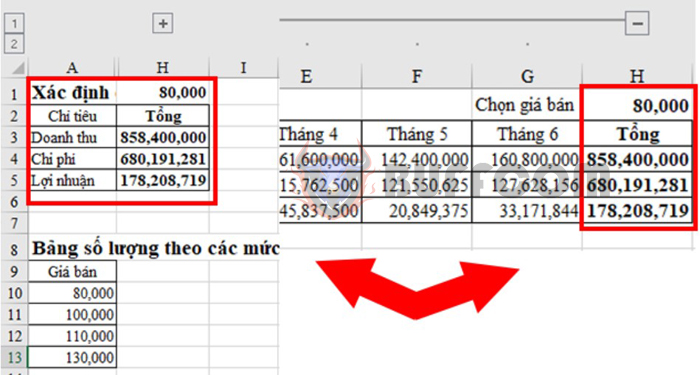
When working with data tables, we often need to handle a lot of parameters, along with using many functions and formulas in Excel. It can be confusing and overwhelming. At this point, the Outline feature can help you summarize and organize data by category, such as managing columns/rows with their own formulas, managing columns/rows related to those formulas. This makes the Excel data table easier to read and manage. Let’s explore how to use the Outline feature in the article below.
Firstly, to use this feature, the data table must meet the following requirements:
Each column must have a column header.
Each column must have data.
The range of cells must contain data, not leaving any blank columns or rows.
Step 1: Open the Settings dialog box
To open the Settings dialog box, first highlight the data range to create an Outline. On the toolbar, select the Data tab, then at the Outline section on the right, click the arrow icon.

Using the Outline feature in Microsoft Excel
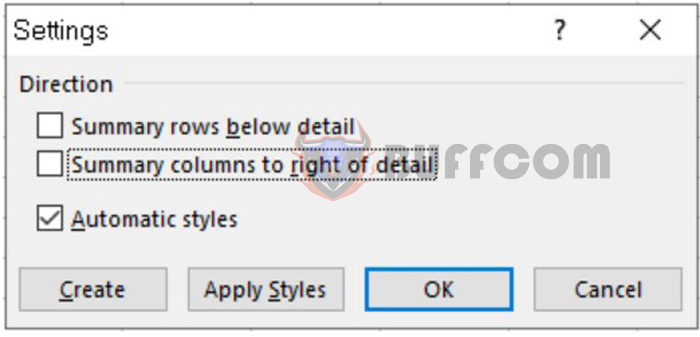
Now, the Settings dialog box will appear. You uncheck the 2 options Summary rows below detail and Summary columns to the right of detail. You can also tick the Automatic Styles option to set the automatic formatting style for the cells, such as bold or italic, to differentiate them. Then press OK to close the dialog box.
Using the Outline feature in Microsoft Excel
Step 2: Create an Outline
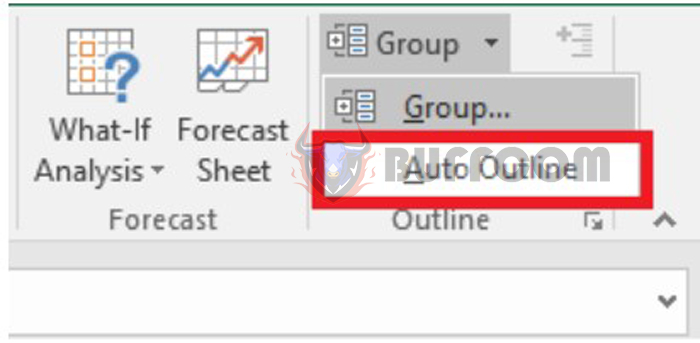
To create an Outline, select Auto Outline in the Group list.
Using the Outline feature in Microsoft Excel
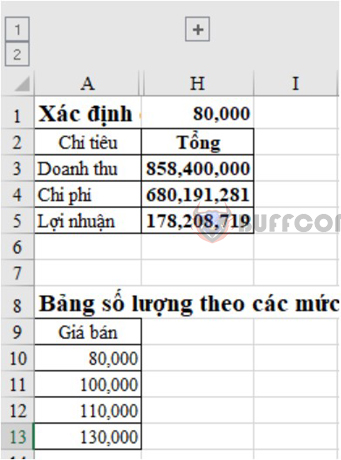
The result is displayed as follows. The Outline icon here is the horizontal line in the data table with grouped columns and the plus and minus symbols.
The content section using a formula (Total column) is formatted separately in bold compared to other rows to differentiate them.

Using the Outline feature in Microsoft Excel
When you click on number 1 or the minus sign, the data table is collapsed, showing only the content that uses the formula (Total column). When you click on number 2 or the plus sign, the data table is displayed in full. Depending on the data table, the hierarchy and data types of the groups will differ.
Using the Outline feature in Microsoft Excel
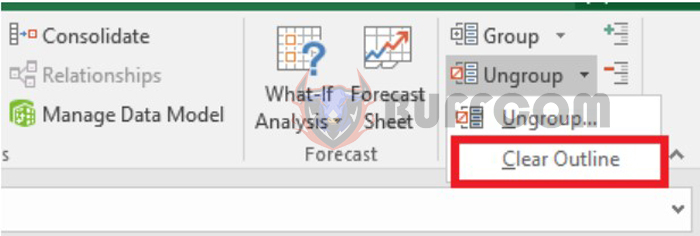
To delete the Outline created, on the toolbar, select the Data tab, then select the Ungroup option and choose Clear Outline. This way, the Outline will be removed from the data table.
Using the Outline feature in Microsoft Excel
After removing the Outline from the data table, if you initially used the Automatic Styles option, you need to reformat the data in the table because the data in the table is still formatted as it is when the Outline was created.
The above is how to use the Outline feature in Excel. We hope you find this article helpful and applicable. Good luck!


