How To Insert Sparklines In Excel

Do you feel overwhelmed by long data rows and find it difficult to track the trend of data changes? Do you want to represent data in a more visual and dynamic way but don’t know how to do it? Don’t worry, Buffcom.net will introduce you to how to insert sparklines, also known as mini-charts, in Excel, which will surely be useful for you.
What is a Sparkline Chart?
A sparkline is a mini-chart that shows the trend of a specific content, not comparing the values of all content like normal charts. Sparkline charts do not have coordinate axes like larger charts. At the same time, when the value of the content or the size of the cell changes, the chart also changes accordingly.
Note Before Inserting Sparklines
To ensure the most effective process of inserting sparklines, your data needs to meet the following criteria:
- Consistency and correct formatting: the data must follow a common format such as numbers, text, currency, etc.
- Clear content: the data fields such as row names and column names need to be complete, accurate, and specific for easy interpretation of the chart.
How to Insert Sparklines
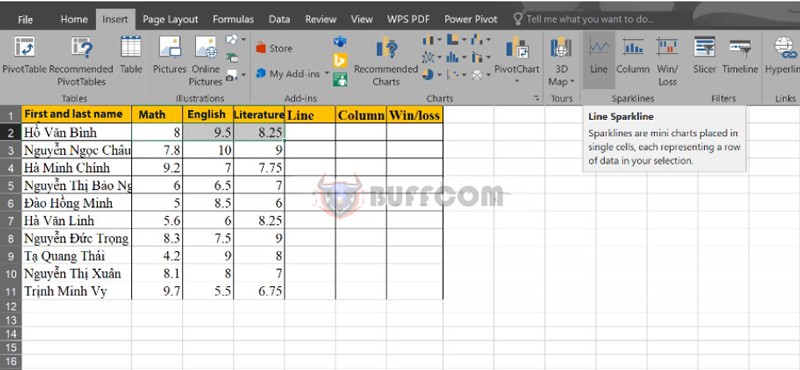
Step 1: Open the data file => Select the data range to insert sparklines => Click on the Insert tab => Select a suitable mini-chart in the Sparklines section.
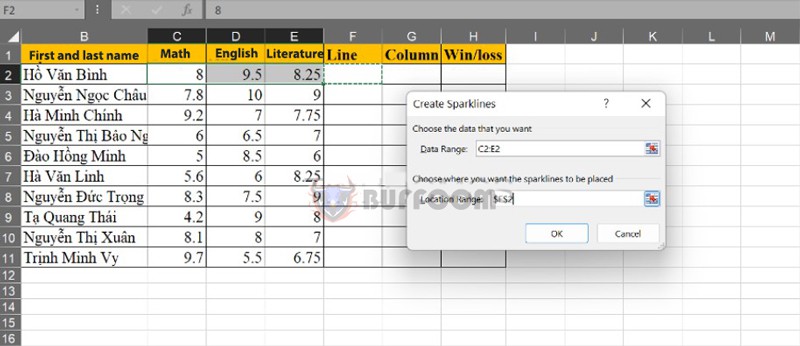
 Step 2: The Create Sparklines dialog box opens => Select the cell or cell range (Location Range) where you want to insert the mini-chart.
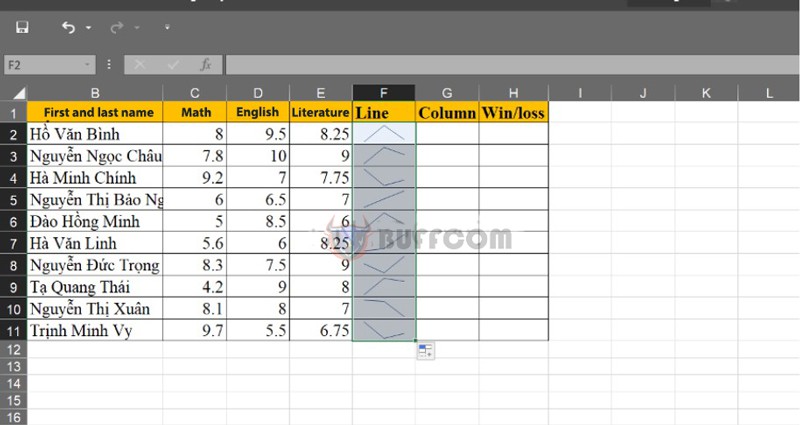
 Step 3: Click OK to complete. Then, click on the bottom right corner of the cell to copy the formula for the remaining data.
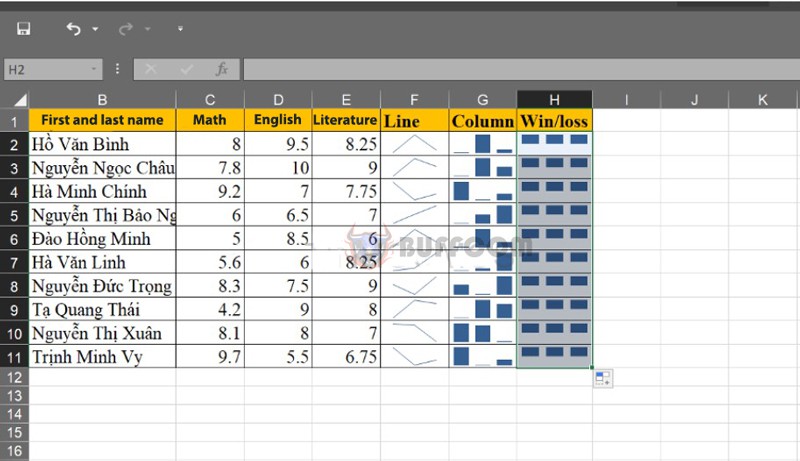
 The same method applies to Column or Win/Loss charts.
How to Edit Sparklines
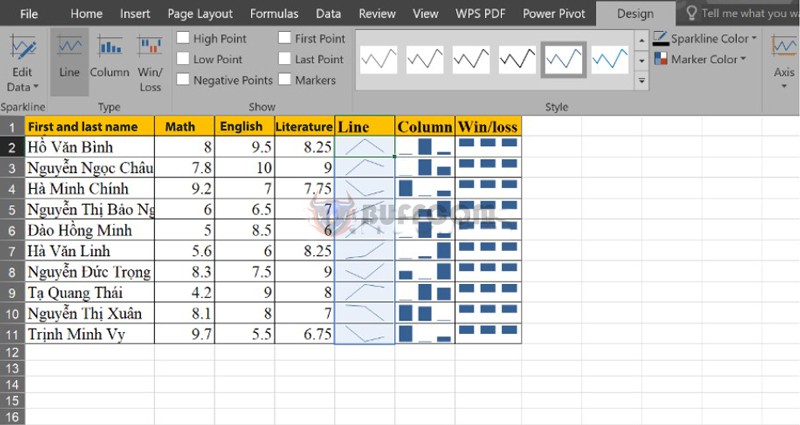
To change the mini-chart, click on the Design tab on the toolbar.
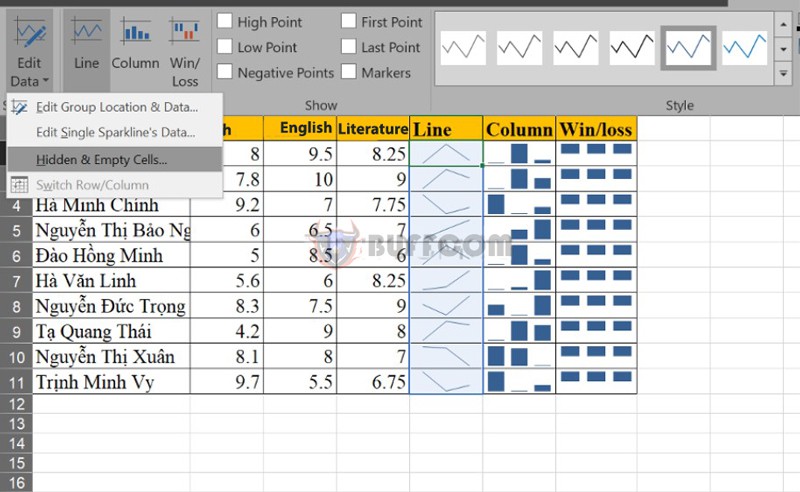
Edit Data
In this section, you can change the data range of the chart or the cell/cell range that contains the chart.
 Show
Show
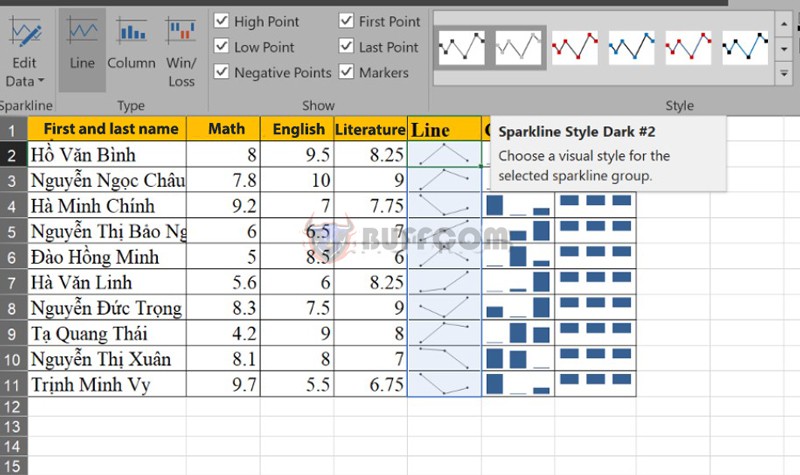
With these commands, you can easily highlight high and low values on the line chart.
- High Point: mark the highest point
- Low Point: mark the lowest point
- First Point: mark the first point
- Last Point: mark the last point
- Negative Points: mark negative points
 Style
Style
This section will have many charts with different colors, allowing you to choose a chart that you like to decorate it beautifully. In particular, you can design the color of your chart in the SparklineColor and MarkerColor sections.
How to Delete Sparkline Charts
There are 2 simple ways to delete mini charts in Sparklines.
Method 1: Select the cell containing the mini chart => Click on the Design tab => Go to the Group section, then select Clear.
 Method 2: Right-click on the mini chart => Select Sparklines => Click on Clear Selected Sparklines or Clear Selected Sparklines Group.
 Conclusion on How to Insert Mini Charts in Excel
Creating mini charts in Sparklines is quite simple, isn’t it? Hopefully, with these sharing, you will create dynamic data charts to better support your work!
If you want to use many features of Office, specifically Excel, please contact Buffcom.net to choose the software you need!

