• Microsoft Office
  • Microsoft Windows
  • Other Software
    • Microsoft Visual
    • Microsoft Project
    • Microsoft Visio
  • Anti Virus
  • Blog
    • Word
    • Excel
    • Powerpoint
    • Software tricks/tips
  • POLICIES
    • PAYMENT GUIDE
    • SHIPPING POLICY
    • REFUND POLICY
    • TERMS & CONDITIONS
    • Contact Us

No products in the cart.

  • Microsoft Office
  • Microsoft Windows
  • Other Software
    • Microsoft Visual
    • Microsoft Project
    • Microsoft Visio
  • Anti Virus
  • Blog
    • Word
    • Excel
    • Powerpoint
    • Software tricks/tips
  • POLICIES
    • PAYMENT GUIDE
    • SHIPPING POLICY
    • REFUND POLICY
    • TERMS & CONDITIONS
    • Contact Us
Excel

How to mark the minimum/maximum value in an Excel chart?

0 Comments

How to mark the minimum/maximum value in an Excel chart? Using charts is one of the most effective ways to visually represent data. The visual effect will be even better if you can highlight the maximum and minimum values on that chart. Read on to learn how to mark Min/Max points on an Excel chart.

Create a chart and mark the Min/Max points on the chart

Create a chart

Assuming you want to draw a chart representing the revenue of the following products:

How to mark the minimum/maximum value in an Excel chart?

How to mark the minimum/maximum value in an Excel chart?

To draw a chart, follow these steps:

Step 1: On the toolbar, select the Insert tab.

Step 2: Choose the Insert Line or Area Chart icon.

Step 3: Choose the chart you find suitable and want to use.

How to mark the minimum maximum value in an Excel chart2In this example, we will choose the line chart. After choosing, the chart will be displayed as follows:

How to mark the minimum/maximum value in an Excel chart?

How to mark the minimum/maximum value in an Excel chart?

Mark the Min/Max points on the chart

How to mark the minimum/maximum value in an Excel chart?

How to mark the minimum/maximum value in an Excel chart?

To be able to mark Min/Max points

first, we need to find the maximum and minimum values ​​in the data table.

To find the minimum value, in the first cell, enter the following command: = IF(B2 = MIN($B$2:$B$7), B2, NA())

Where:

+ B2 is the cell containing the value to be compared.

+ $B$2:$B$7: The range contains values ​​to find Min/Max. This data range must be fixed so that when copying down the cells, it will not shift. Therefore, after selecting this range, press F4 to fix it.

How to mark the minimum/maximum value in an Excel chart?

How to mark the minimum/maximum value in an Excel chart?

After pressing Enter, copy it to the cells below. If it is not the minimum value, Excel will return #N/A, and it will return the value of the corresponding cell if it is the minimum value.

To find the maximum value, you do the same, but we will use the Max function. Enter the following command: = IF(B2 = MAX($B$2:$B$7), B2, NA())

How to mark the minimum/maximum value in an Excel chart?

How to mark the minimum/maximum value in an Excel chart?

Then copy the formula down to find the maximum value.

Once done, we will start displaying these 2 Min and Max points on the chart. Follow these steps:

Step 1: Click on the chart just created above. At this time, the data range used to create the chart will be highlighted.

Step 2: Expand that data range to the 2 columns Min and Max so that these 2 columns are also highlighted.

After finishing, we will see 2 points marked on the chart as shown below. These are the Min point and the Max point.

How to mark the minimum/maximum value in an Excel chart?

How to mark the minimum/maximum value in an Excel chart?

Format the chart

After displaying the 2 Min and Max points, we will format them to make them more visually appealing through some steps as follows.

First, we will change the color, shape, and size of these 2 points:

How to mark the minimum/maximum value in an Excel chart?

How to mark the minimum/maximum value in an Excel chart?

Step 1: Click on the chart, then press Ctrl + 1. The Format Data Series dialog box will appear.

Step 2: Select the Series Options item. Then, to format the Min point, select the “Min” Series, and conversely, to format the Max point, select the “Max” Series.

How to mark the minimum/maximum value in an Excel chart?

How to mark the minimum/maximum value in an Excel chart?

Step 3: Click on the Fill & Line icon to select Marker. Then select Marker Options to change the format. Here, you can change the icon, color, border, icon size, etc.

How to mark the minimum/maximum value in an Excel chart?

How to mark the minimum/maximum value in an Excel chart?

Next, we will display the values of the 2 Min and Max points on the chart.

Step 1: Right-click on the Min (or Max) point. Then select Add Data Labels. The value of the Min (Max) point will now be displayed on the chart.

How to mark the minimum/maximum value in an Excel chart?

How to mark the minimum/maximum value in an Excel chart?

Step 2: Right-click on the value, then select Format Data Labels.

How to mark the minimum/maximum value in an Excel chart?

How to mark the minimum/maximum value in an Excel chart?

When the Format Data Labels dialog box appears, set the Label Position as follows:

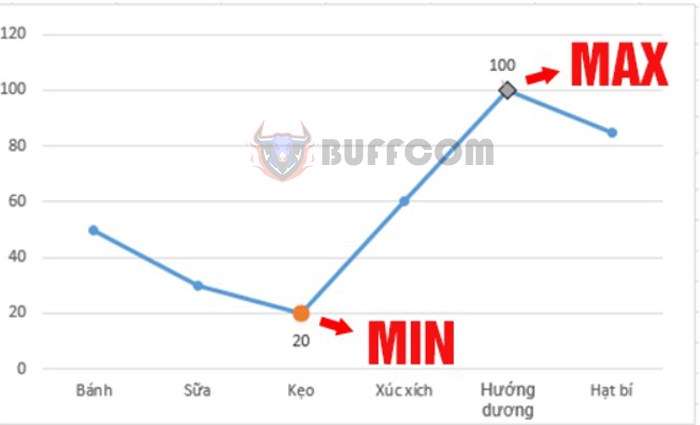
Select Above for the Max point to display the value above it.
Select Below for the Min point to display the value below it.

How to mark the minimum/maximum value in an Excel chart?

How to mark the minimum/maximum value in an Excel chart?

The final result is illustrated in the figure below:

How to mark the minimum/maximum value in an Excel chart?

How to mark the minimum/maximum value in an Excel chart?

Above are the steps to mark Min and Max points on a chart in Excel. We invite readers to refer and apply them. Wish you success.

Rate this post
32
257 Views
How to insert multiple images into cells in ExcelPrevHow to insert multiple images into cells in ExcelMarch 9, 2023
14 Good Tips and Tricks In Word For YouMarch 10, 202314 Good Tips and Tricks In Word For YouNext

Leave a Reply Cancel reply

You must be logged in to post a comment.

Buy Windows 11 Professional MS Products CD Key
Buy Office 2021 Professional Plus Key Global For 5 PC
Top rated products
  • Kaspersky Internet Security 2021 1 year 5 devices key Global Kaspersky Internet Security 2021 1 year 5 devices key Global
    Rated 5.00 out of 5
    $45.00
  • Windows Server 2022 Datacenter Key Global Windows Server 2022 Datacenter Key Global
    Rated 5.00 out of 5
    $7.00
  • Kaspersky Small Office Security 10 PCs + 10 Mobiles + 1 Server 1 Year Kaspersky Small Office Security 10 PCs + 10 Mobiles + 1 Server 1 Year
    Rated 5.00 out of 5
    $164.50
  • Avast Ultimate Suite 2021 1 Year 10 Devices Global Avast Ultimate Suite 2021 1 Year 10 Devices Global
    Rated 5.00 out of 5
    $54.00
  • Windows 11 Pro Key Global Windows 11 Pro Key Global
    Rated 5.00 out of 5
    $6.00
Products
  • Buy Office 2021 Professional Plus Key Global For 5 PC Buy Office 2021 Professional Plus Key Global For 5 PC
    Rated 5.00 out of 5
    $68.00
  • Avast Ultimate Suite 2021 3 Years 10 Devices Global Avast Ultimate Suite 2021 3 Years 10 Devices Global
    Rated 5.00 out of 5
    $90.00
  • AVG Ultimate 2021 with Antivirus + Cleaner, Secure VPN 10 Devices 2 Years AVG Ultimate 2021 with Antivirus + Cleaner, Secure VPN 10 Devices 2 Years
    Rated 5.00 out of 5
    $47.00
  • Windows 10 Pro N Key Global Windows 10 Pro N Key Global
    Rated 4.83 out of 5
    $10.00
  • Buy Windows 11 Pro CD Key License Buy Windows 11 Pro CD Key License
    Rated 5.00 out of 5
    $6.00
  • Windows 10 Pro Key Global 20 PC Windows 10 Pro Key Global 20 PC $50.00
  • Kaspersky Internet Security 2021 1 year 5 devices key Global Kaspersky Internet Security 2021 1 year 5 devices key Global
    Rated 5.00 out of 5
    $45.00
  • Windows 11 Pro Product Activation Key Windows 11 Pro Product Activation Key
    Rated 5.00 out of 5
    $6.00
  • Windows Server 2025 Remote Desktop Services 50 User Connections Windows Server 2025 Remote Desktop Services 50 User Connections $25.00
  • Kaspersky Small Office Security 10 PCs + 10 Mobiles + 1 Server 1 Year Kaspersky Small Office Security 10 PCs + 10 Mobiles + 1 Server 1 Year
    Rated 5.00 out of 5
    $164.50
Product categories
  • Anti Virus
  • Microsoft Office
  • Microsoft Project
  • Microsoft Visio
  • Microsoft Visual
  • Microsoft Windows
  • Other Software
  • Uncategorized

Buffcom.net always brings the best digital products and services to you. Specializing in Office Software and online marketing services

BIG SALE 50% IN MAY

Microsoft Office
Microsoft Windows
Anti-Virus
Contact Us

Visit Us:

125 Division St, New York, NY 10002, USA

Mail Us:

buffcom.net@gmail.com

TERMS & CONDITIONS | PAYMENT GUIDE  | SHIPPING POLICY  | REFUND POLICY

Copyright © 2019 buffcom.net  All Rights Reserved.