• Microsoft Office
  • Microsoft Windows
  • Other Software
    • Microsoft Visual
    • Microsoft Project
    • Microsoft Visio
  • Anti Virus
  • Blog
    • Word
    • Excel
    • Powerpoint
    • Software tricks/tips
  • POLICIES
    • PAYMENT GUIDE
    • SHIPPING POLICY
    • REFUND POLICY
    • TERMS & CONDITIONS
    • Contact Us

No products in the cart.

  • Microsoft Office
  • Microsoft Windows
  • Other Software
    • Microsoft Visual
    • Microsoft Project
    • Microsoft Visio
  • Anti Virus
  • Blog
    • Word
    • Excel
    • Powerpoint
    • Software tricks/tips
  • POLICIES
    • PAYMENT GUIDE
    • SHIPPING POLICY
    • REFUND POLICY
    • TERMS & CONDITIONS
    • Contact Us
Excel

How to automatically adjust chart axis scaling in Excel
0 Comments

How to automatically adjust chart axis scaling in Excel. Creating a chart in Excel is very simple, but dividing the X and Y axis scaling symmetrically and aesthetically is still a problem for many Excel users. In this article, UniTrain will guide you through two automatic methods to adjust chart axis scaling in Excel: 1. Using the Format Axis feature in Excel 2. Running VBA code in Excel

1. Using the Format Axis feature to change adjust chart axis scaling in Excel

To automatically change the chart axis by using the Format Axis feature in Excel, follow these steps:

Step 1: Create data for the X and Y axes (as shown below).
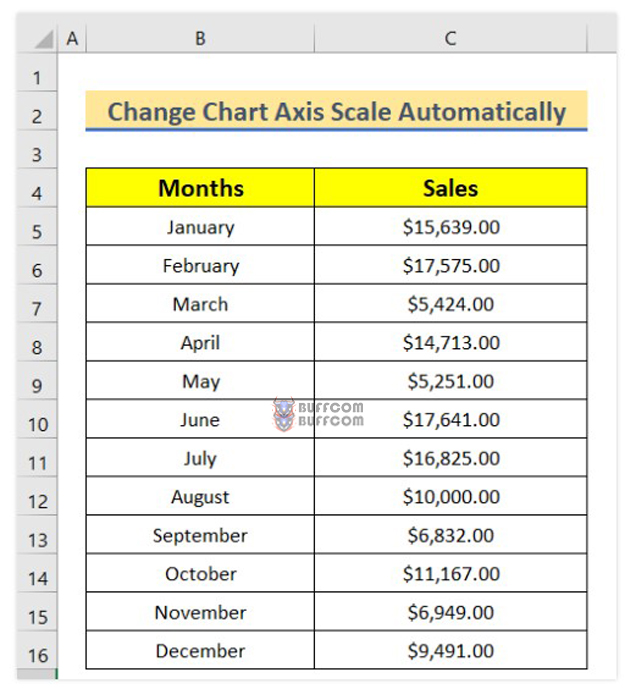
How to automatically adjust chart axis scaling in Excel

How to automatically adjust chart axis scaling in Excel

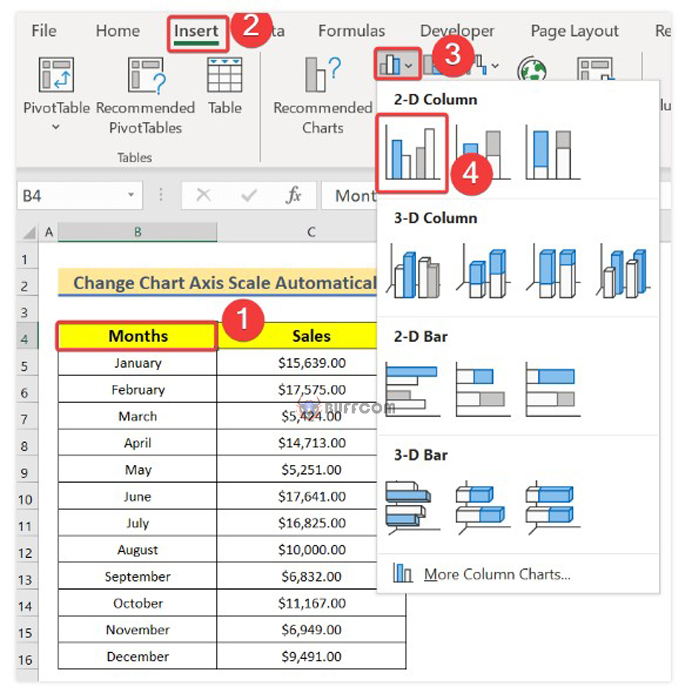
Step 2: Insert a 2-D column chart by selecting cell B4 > Insert > selecting the chart icon and inserting a column chart (as shown below).
How to automatically adjust chart axis scaling in Excel

How to automatically adjust chart axis scaling in Excel

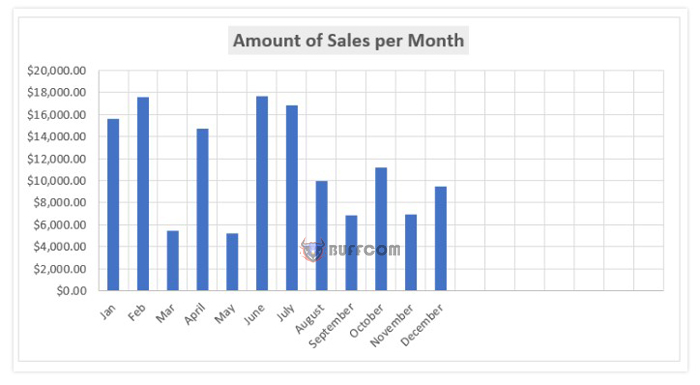
Then, the column chart will be displayed as shown below:
How to automatically adjust chart axis scaling in Excel

How to automatically adjust chart axis scaling in Excel

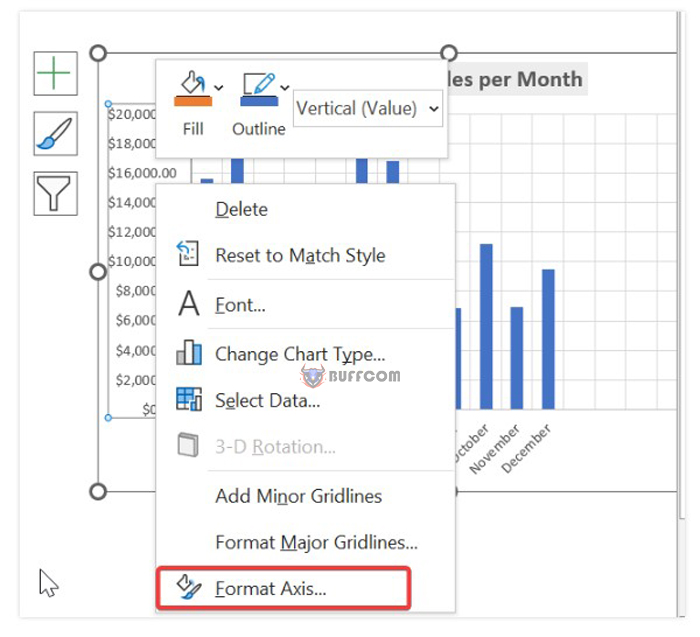
Step 3: Right-click and select Format Axis.
How to automatically adjust chart axis scaling in Excel

How to automatically adjust chart axis scaling in Excel

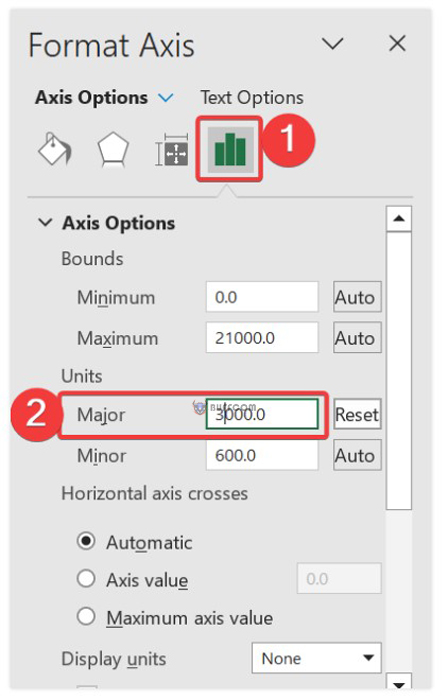
Then, select Axis option > Units > change it to 3000.
How to automatically adjust chart axis scaling in Excel

How to automatically adjust chart axis scaling in Excel

You will see that Maximum Bounds will automatically change from 20000 to 21000, and the unit of the Y-axis will change from 2000 to 3000 as shown below:
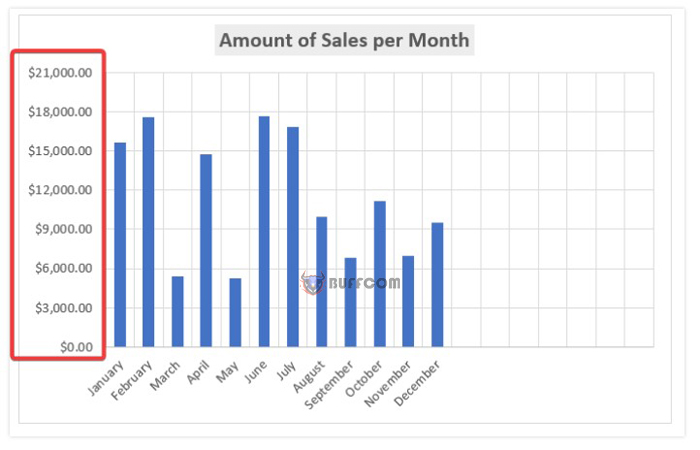
How to automatically adjust chart axis scaling in Excel

How to automatically adjust chart axis scaling in Excel

However, for the X-axis, users cannot change the scaling because they are using text instead of values. That’s why users keep the chart’s horizontal data unchanged. Right-click > select Format Axis > select Automatically select based on data in the Axis Type section and Automatic in the Vertical axis crosses section.
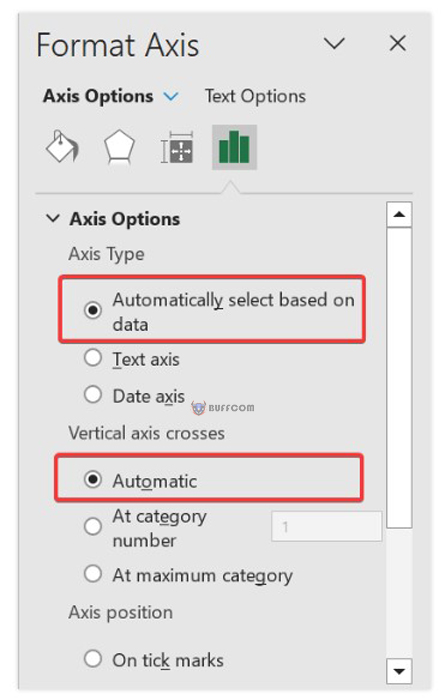
adjust chart axis scaling 72. Run Excel VBA code to automatically change chart axis scale

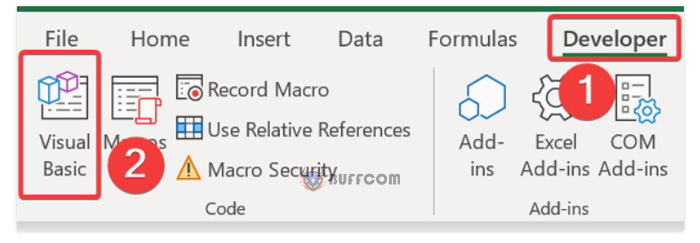
Procedure: Step 1: Select Developer > Visual Basic.
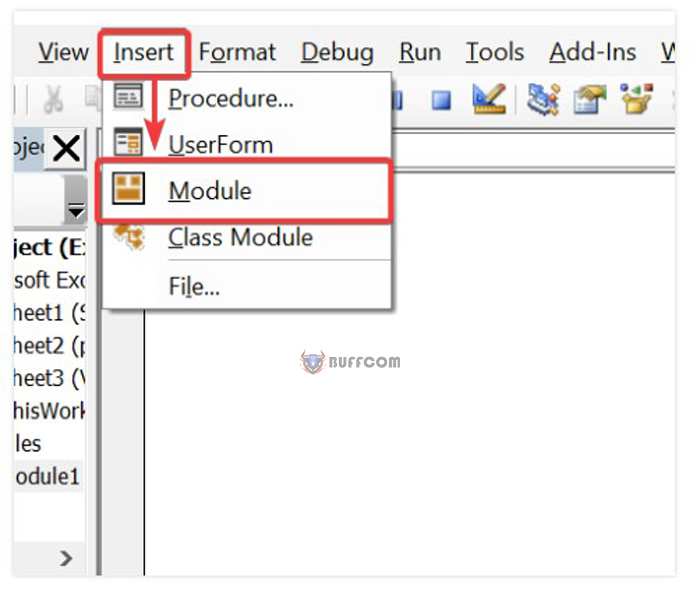
adjust chart axis scaling 8When the Microsoft Visual Basic for Applications window appears, select Insert > Module.
adjust chart axis scaling 9Step 2: Insert the code below into the Module.

Function ChartAxisScale(sheetName As String, chartName As String, MinOrMax As String, _
ValueOrCategory As String, PrimaryOrSecondary As String, Value As Variant)
Dim chart As chart
Dim text As String
‘Set the function to control the chart
Set chart = Application.Caller.Parent.Parent.Sheets(sheetName) _
.ChartObjects(chartName).chart
‘Set Primary axis Value
If (ValueOrCategory = “Value” Or ValueOrCategory = “Y”) _
And PrimaryOrSecondary = “Primary” Then
With chart.Axes(xlValue, xlPrimary)
If IsNumeric(Value) = True Then
If MinOrMax = “Max” Then .MaximumScale = Value
If MinOrMax = “Min” Then .MinimumScale = Value
Else
If MinOrMax = “Max” Then .MaximumScaleIsAuto = True
If MinOrMax = “Min” Then .MinimumScaleIsAuto = True
End If
End With
End If
‘Set Primary axis Category
If (ValueOrCategory = “Category” Or ValueOrCategory = “X”) _
And PrimaryOrSecondary = “Primary” Then
With chart.Axes(xlCategory, xlPrimary)
If IsNumeric(Value) = True Then
If MinOrMax = “Max” Then .MaximumScale = Value
If MinOrMax = “Min” Then .MinimumScale = Value
Else
If MinOrMax = “Max” Then .MaximumScaleIsAuto = True
If MinOrMax = “Min” Then .MinimumScaleIsAuto = True
End If
End With
End If
‘Set secondary axis value
If (ValueOrCategory = “Value” Or ValueOrCategory = “Y”) _
And PrimaryOrSecondary = “Secondary” Then
With chart.Axes(xlValue, xlSecondary)
If IsNumeric(Value) = True Then
If MinOrMax = “Max” Then .MaximumScale = Value
If MinOrMax = “Min” Then .MinimumScale = Value
Else
If MinOrMax = “Max” Then .MaximumScaleIsAuto = True
If MinOrMax = “Min” Then .MinimumScaleIsAuto = True
End If
End With
End If
‘Set secondary axis category
If (ValueOrCategory = “Category” Or ValueOrCategory = “X”) _
And PrimaryOrSecondary = “Secondary” Then
With chart.Axes(xlCategory, xlSecondary)
If IsNumeric(Value) = True Then
If MinOrMax = “Max” Then .MaximumScale = Value
If MinOrMax = “Min” Then .MinimumScale = Value
Else
If MinOrMax = “Max” Then .MaximumScaleIsAuto = True
If MinOrMax = “Min” Then .MinimumScaleIsAuto = True
End If
End With
End If
If IsNumeric(Value) Then text = Value Else text = “Auto”
ChartAxisScale = ValueOrCategory & ” ” & PrimaryOrSecondary & ” ” _
& MinOrMax & “: ” & text
End Function
Sub Axis_Scale()
End Sub
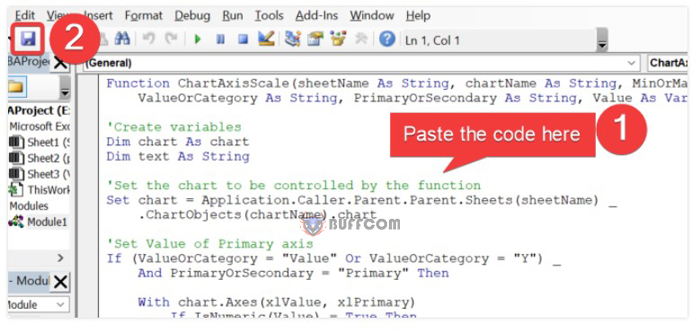
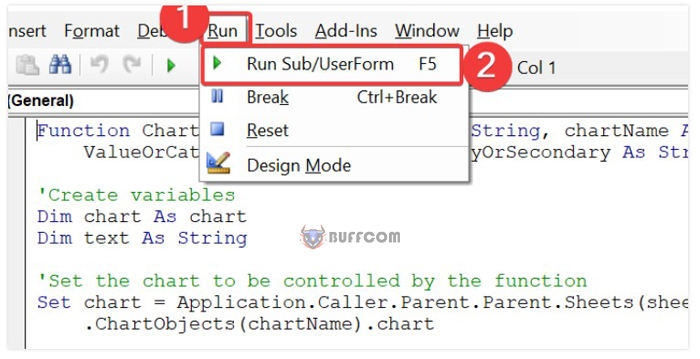
adjust chart axis scaling 10Then, select Run > Run Sub/UserForm.

adjust chart axis scaling 11
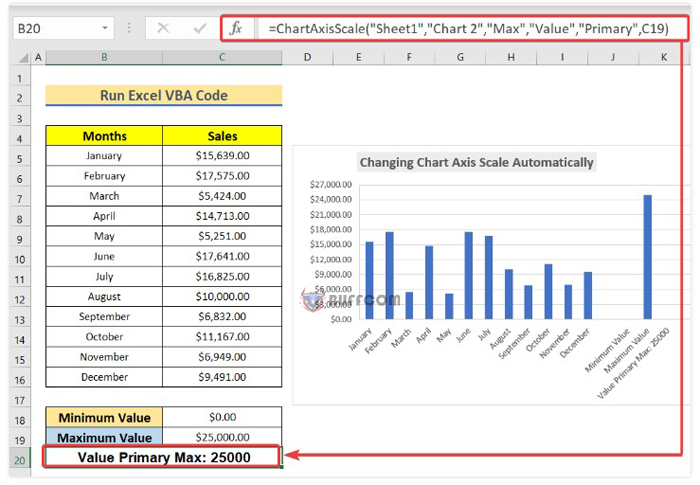
After running the VBA code, you can create a user-defined function.
Then, go back to the Excel worksheet, select cell B20 and enter: =ChartAxisScale(“Sheet1″,”Chart 2″,”Max”,”Value”,”Primary”,C19)
adjust chart axis scaling 12

Rate this post
36
279 Views
Moving a window to another screen on Windows 10PrevMoving a window to another screen on Windows 10March 27, 2023
How to Change Default Browser in Windows 10March 27, 2023How to Change Default Browser in Windows 10Next

Leave a Reply Cancel reply

You must be logged in to post a comment.

Buy Windows 11 Professional MS Products CD Key
Buy Office 2021 Professional Plus Key Global For 5 PC
Top rated products
  • Kaspersky Total Security 2021 1 year 1 device key Global Kaspersky Total Security 2021 1 year 1 device key Global
    Rated 5.00 out of 5
    $27.00
  • Avast Ultimate Suite 2021 2 Years 10 Devices Global Avast Ultimate Suite 2021 2 Years 10 Devices Global
    Rated 5.00 out of 5
    $77.00
  • Buy Windows 11 Pro CD Key License Buy Windows 11 Pro CD Key License
    Rated 5.00 out of 5
    $6.00
  • Kaspersky Total Security 2021 1 year 5 devices key Global Kaspersky Total Security 2021 1 year 5 devices key Global
    Rated 5.00 out of 5
    $46.00
  • Avast Premium Security 2021 Avast Premium Security 2021 1 Device 1 Year Global
    Rated 5.00 out of 5
    $11.00
Products
  • Microsoft Visio Standard 2019 Key 1PC Microsoft Visio Standard 2019 Key 1PC $12.00
  • Microsoft Project 2019 professional Key Global Bind to your Microsoft Account Microsoft Project 2019 professional Key Global Bind to your Microsoft Account
    Rated 4.93 out of 5
    $12.00
  • Avast Premium Security 2021 Avast Premium Security 2021 1 Device 1 Year Global
    Rated 5.00 out of 5
    $11.00
  • Microsoft Visio Professional 2021 Key 1PC Microsoft Visio Professional 2021 Key 1PC $13.00
  • Windows 10 Pro OEM Key Global - Reinstalling win is still active Windows 10 Pro OEM Key Global - Reinstalling win is still active
    Rated 4.88 out of 5
    $6.00
  • Windows 10 Education Key Global Windows 10 Education Key Global
    Rated 4.84 out of 5
    $9.00
  • Microsoft Project 2016 professional CD Key Global Microsoft Project 2016 professional CD Key Global
    Rated 4.97 out of 5
    $9.00
  • microsoft office home and business 2019 pcmac key Microsoft Office Home And Business 2019 (MAC) key bind to your Microsoft account
    Rated 4.95 out of 5
    $30.00
  • Microsoft Visio Professional 2010 Key 1PC Microsoft Visio Professional 2010 Key 1PC $9.00
  • Windows Server 2016 Essentials Key Global Windows Server 2016 Essentials Key Global
    Rated 4.79 out of 5
    $10.00
Product categories
  • Anti Virus
  • Microsoft Office
  • Microsoft Project
  • Microsoft Visio
  • Microsoft Visual
  • Microsoft Windows
  • Other Software
  • Uncategorized

Buffcom.net always brings the best digital products and services to you. Specializing in Office Software and online marketing services

BIG SALE 50% IN MAY

Microsoft Office
Microsoft Windows
Anti-Virus
Contact Us

Visit Us:

125 Division St, New York, NY 10002, USA

Mail Us:

buffcom.net@gmail.com

TERMS & CONDITIONS | PAYMENT GUIDE  | SHIPPING POLICY  | REFUND POLICY

Copyright © 2019 buffcom.net  All Rights Reserved.