• Microsoft Office
  • Microsoft Windows
  • Other Software
  • Anti Virus
  • Blog
    • Word
    • Excel
    • Powerpoint
    • Software tricks/tips
  • POLICIES
    • PAYMENT GUIDE
    • SHIPPING POLICY
    • REFUND POLICY
    • TERMS & CONDITIONS
    • Contact Us

No products in the cart.

  • Microsoft Office
  • Microsoft Windows
  • Other Software
  • Anti Virus
  • Blog
    • Word
    • Excel
    • Powerpoint
    • Software tricks/tips
  • POLICIES
    • PAYMENT GUIDE
    • SHIPPING POLICY
    • REFUND POLICY
    • TERMS & CONDITIONS
    • Contact Us

No products in the cart.

  • Microsoft Office
  • Microsoft Windows
  • Other Software
  • Anti Virus
  • Blog
    • Word
    • Excel
    • Powerpoint
    • Software tricks/tips
  • POLICIES
    • PAYMENT GUIDE
    • SHIPPING POLICY
    • REFUND POLICY
    • TERMS & CONDITIONS
    • Contact Us

No products in the cart.

  • Microsoft Office
  • Microsoft Windows
  • Other Software
  • Anti Virus
  • Blog
    • Word
    • Excel
    • Powerpoint
    • Software tricks/tips
  • POLICIES
    • PAYMENT GUIDE
    • SHIPPING POLICY
    • REFUND POLICY
    • TERMS & CONDITIONS
    • Contact Us
Excel

Calculating Forecast Vs Actual Variance in Excel

0 Comments

Calculating Forecast Vs Actual Variance in Excel. Forecasting plays a crucial role in business management, and comparing actual outcomes with forecasted values is essential for project evaluation. To efficiently calculate the variance between actual and forecasted data, utilizing a reliable tool or dashboard in Excel is highly recommended. In this article, we will demonstrate how to compare forecasted and actual data using formulas in Excel.

Calculating Forecast Vs Actual Variance in Excel

Generic Formula for Variance between Forecast and Actual:

=ACTUAL – FORECAST

ACTUAL: Represents the actual data or amount gathered. FORECAST: Represents the forecasted data or amount.

In this formula, we simply subtract the forecasted value from the actual value, as we typically expect the actual value to be larger than the forecasted value. However, this can be reversed if we anticipate the actual value to be less than the forecast.

Calculating Forecast Vs Actual Variance in Excel

Calculating Forecast Vs Actual Variance in Excel

Let’s walk through an example to create a Forecast vs Target Report with Variance in Excel:

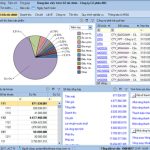
Suppose we have sales data for stationery products in different months. Using some Excel forecast formulas, we have predicted sales and unit production for each month. As the months pass, we gather actual sales and production data in Excel. Now, our goal is to create a report that displays the variance between actual and forecasted values. By variance, we mean the difference between these two values. No special variance formula is required, as we can simply subtract the forecasted data from the actual data.

Example:

To calculate the variance of units, write the following formula in cell H2 and drag it down for the entire column (for this example):

=F3 – B3

This formula will return the difference between the actual and forecasted unit values. If the actual value exceeds the forecasted value, we will see a positive difference, and vice versa.

Similarly, to calculate the variance of collections, write this formula in cell J2 and drag it down:

=G3 – C3

This formula returns the variance in the collection amounts.

Calculating Forecast Vs Actual Variance in Excel

Calculating Forecast Vs Actual Variance in Excel

To get the percentage variance of units and collections, use these Excel formulas:

=(F3 / B3) – 100% =(G3 / C3) – 100%

A negative percentage indicates a negative variance, while a positive percentage represents a positive variance. You can apply conditional formatting to highlight negative values with red text for better visualization.

Calculating Forecast Vs Actual Variance in Excel

Calculating Forecast Vs Actual Variance in Excel

Using this approach, you can easily create reports based on actual versus forecasted data. This will streamline the analysis process and facilitate decision-making. I hope this explanation was clear enough. If you have any specific queries regarding forecasting formulas in Excel or any other Excel-related topics, feel free to ask in the comments section below.

3
22 Views
Counting Cells with Exclusion Criteria in ExcelPrevCounting Cells with Exclusion Criteria in ExcelJuly 31, 2023
A Comparison of the Best Accounting Software Online vs. Offline (MISA, Fast, Bravo,...)August 1, 2023A Comparison of the Best Accounting Software Online vs. Offline (MISA, Fast, Bravo,...)Next

Leave a Reply Cancel reply

Your email address will not be published. Required fields are marked *

Recent Posts
  • Retrieve Data Based on Data Validation
    September 7, 2023
    Excel
  • How to Convert Multiple Rows to Columns and Rows in Excel?
    September 6, 2023
    Excel
  • VLOOKUP for Automatic Discount in Data Validation
    September 6, 2023
    Excel
  • How to Convert Text Dates to Dates in Excel?
    September 5, 2023
    Excel
Categories
  • Blog 80
  • Excel 754
  • Powerpoint 36
  • Software tricks/tips 128
  • Uncategorized 8
  • Word 109
Tags
the ISERROR
Top rated products
  • Kaspersky Small Office Security 15 PCs + 15 Mobiles + 2 Servers 1 Year Kaspersky Small Office Security 15 PCs + 15 Mobiles + 2 Servers 1 Year
    Rated 5.00 out of 5
    $201.00
  • Buy Windows 11 Professional MS Products CD Key
    Rated 5.00 out of 5
    $11.00
  • AVG Internet Security 2021 1 Device 1 Year Global AVG Internet Security 2021 1 Device 1 Year Global
    Rated 5.00 out of 5
    $11.00
  • Buy Office 2021 Professional Plus Key Global For 5 PC
    Rated 5.00 out of 5
    $45.00
  • Avast SecureLine VPN 2021 2 Years 5 Devices Global Avast SecureLine VPN 2021 2 Years 5 Devices Global
    Rated 5.00 out of 5
    $47.00
Products
  • Buy Office 2021 Professional Plus Key Global For 5 PC
    Rated 5.00 out of 5
    $45.00
  • Buy Office 2021 Professional Plus Key Global Bind To Your Microsoft Account
    Rated 4.83 out of 5
    $49.00
  • Windows Server 2022 Datacenter Key Global
    Rated 5.00 out of 5
    $15.00
  • Windows Server 2022 Standard Key Global
    Rated 4.47 out of 5
    $15.00
  • Windows Server 2022 Remote Desktop Services Device Connections (50) Cal Key Global
    Rated 5.00 out of 5
    $45.00

Buffcom.net always brings the best digital products and services to you. Specializing in Office Software and online marketing services

BIG SALE 50% IN MAY

Microsoft Office
Microsoft Windows
Anti-Virus
Contact Us

Visit Us:

125 Division St, New York, NY 10002, USA

Mail Us:

buffcom.net@gmail.com

TERMS & CONDITIONS | PAYMENT GUIDE  | SHIPPING POLICY  | REFUND POLICY

Copyright © 2019 buffcom.net  All Rights Reserved.